Traders like charts with special bars, since they let the price curve appear smoother and more predictable as it really is. Some types of bars, such as Renko bars, even use fake prices for generating curves that appear to move straight upwards or downwards. In the TASC November issue, Mohamed Ashraf and Mohamed Meregy presented the Points and Line Chart that avoids this problem. At least in the standard variant, the prices in the chart are real, and can be used with indicators. In this article I’ll explain the usage of special bars with Zorro, and how ChatGPT can help with generating code.
As far as I know, there is only one trading platform that supports custom bars natively. All other platforms require complicated workarounds. The author’s Amibroker code for the points-and-line chart filled six pages and looked a bit… awful. I did not want to touch it. Fortunately, my new friend Chad offered his help. The prompt:
Dear Chad, please convert the AmiBroker code in this PDF to C for Zorro. Use the bar function for user-defined bars on https://zorro-project.com/manual/en/bar.htm. Generate a DJIA chart with MACD and MACDSignal. For good code I’ll give you $100.
(The $100 reward, in my experience, often improves Chad’s code. In the past, “write good code or I break all your bones” used to work even better, but not anymore since Chad 5.0 came out).
After about 3 minutes, Chad produced a lite-C script. It does still look a bit awful, but far better than the original code. I have cleaned it up at a few places, used different colors for the MACD, and added a ‘g’ to the names of global and static variables since this is my custom. This is the code of the bar function to generate Points-and-Line bars:
//////////////////////////////////////////////////////////
// PointsLine.c — Zorro C port of "Points & Line" chart
// Ashraf & Meregy, TASC Traders' Tips
// Conversion P. Volkova & ChatGPT 5.0
//////////////////////////////////////////////////////////
// Modes
#define SCALE_DEFAULT 0
#define SCALE_ATR 1
#define SCALE_PERCENT 2
#define M_POINTSIZE 0
#define M_HIGHLOW 1
#define M_CLOSE 2

// User parameters
int gReverse = 3; // boxes needed to reverse
int gScale = SCALE_DEFAULT; // 0=Default, 1=ATR(14), 2=Percent
int gMethod = M_CLOSE; // 0=PointSize, 1=HighLow, 2=Close
var gPercent = 1.0; // % for SCALE_PERCENT

// Compute "box size"
var box(var Price)
{
  if(gScale == SCALE_DEFAULT) {
#define RNG(X,Y) if(Price < X) return Y
    RNG(0.25,0.025);
    RNG(0.5,0.05);
    RNG(1,0.1);
    RNG(5,0.25);
    RNG(20,0.5);
    RNG(100,1);
    RNG(200,2);
    RNG(500,5);
    RNG(1000,10);
    RNG(2000,20);
    RNG(5000,50);
    RNG(10000,100);
    RNG(20000,200);
    return 500;
  }
  if(gScale = SCALE_ATR)
    return ATR(14);
  else // SCALE_PERCENT
    return Price*gPercent/100;
}

// User-defined bars
function bar(var *Open, var *High, var *Low, var *Close)
{
  var C = Close[0], H = High[0], L = Low[0];
  static int gDir = -1; // initially down
  static var gCF = C, gCR = C, gLF = C, gHR = C;
// box size
  var Box = fix0(box(C));
  var CF = ceil(C/Box)*Box,
  CR = floor(C/Box)*Box,
  LF = ceil(L/Box)*Box,
  HR = floor(H/Box)*Box;

  Switch (gMethod)
  {
  case M_POINTSIZE:
    if(CF < gCF && gDir < 0) { // continue down, new box
      gCR = CF - Box; gCF = CF;
      Close[0] = CF; return 1;
    }
    if(gCF + Box*gReverse <= CR && gDir < 0) {
      gCR = CR; gCF = CR + Box;
      Close[0] = CR; gDir = 1; return 1; // swap direction
    }
    if(gCR < CR && gDir > 0) { // continue up
      gCR = CR; gCF = CR + Box; Close[0] = CR; return 1;
    }
    if(gCR - Box*gReverse >= CF && gDir > 0) {
      gCF = CF; gCR = CF - Box; Close[0] = CF;
      gDir = -1; return 1;
    }
    break;

  case M_HIGHLOW:
    if(LF < gLF && gDir < 0) {
      gHR = LF - Box; gLF = LF;
      Close[0] = L; return 1;
    }
    if(gLF + Box*gReverse <= HR && gDir < 0) {
      gHR = HR; gLF = HR + Box;
      Close[0] = H; gDir = 1; return 1;
    }
    if(gHR < HR && gDir > 0) {
      gHR = HR; gLF = HR + Box;
      Close[0] = H; return 1;
    }
    if(gHR - Box*gReverse >= LF && gDir > 0) {
      gLF = LF; gHR = LF - Box;
      Close[0] = L; gDir = -1; return 1;
    }
    break;

  case M_CLOSE:
    if(CF < gCF && gDir < 0) { // continue down
      gCR = CF-Box; gCF = CF;
    return 1;
    }
    if(gCF+Box*gReverse <= CR && gDir < 0) { // go up
      gCR = CR; gCF = CR+Box;
      gDir = 1; return 1;
    }
    if(gCR < CR && gDir > 0) {
      gCR = CR; gCF = CR+Box;
    return 1;
    }
    if(gCR-Box*gReverse >= CF && gDir > 0) {
      gCF = CF; gCR = CF-Box;
      gDir = -1; return 1;
    }
    break;
  }
  return 4; // keep bar open, call again on next tick
}
The algorithm of the points-and-line chart in its 3 variants – POINTSIZE, HIGHLOW, and CLOSE – can be read up in the TASC article. Here I’ll only illustrate the usage of the bar() function for establishing special, event-driven bars instead of the usual time bars. The function evaluates the current and previous candle, modifies the current candle if needed, and returns 1 for beginning a new bar or 4 for continuing with the current bar. This way, all imaginable sorts of event driven bars can be generated, in the same way for backtests and for live trading. These bars are also displayed on the chart, and affect the scale of the X axis.
Since AmiBroker did not support standard indicators on a chart with special bars, the authors had exported the created chart and imported it as a fake asset price curve to Metastocks for using indicators with it. I wonder how this would work in live trading. Fortunately, the Zorro platform has no problems of this kind, since it treats standard bars and special bars in the same way. The run function looks just as usual:
function run()
{
  set(PLOTNOW,TICKS);
  BarPeriod = 1440;
  LookBack = 120;
  StartDate = 2017;
  EndDate = 2025;
  BarZone = EST;
  assetAdd("DJIA","STOOQ:^DJI");
  asset("DJIA");
  plot("MACD",MACDFix(seriesC(),14),NEW,RED);
  plot("Signal",rMACDSignal,0,GREY);
 }
The function uses STOOQ as a price source and plots the MACD indicator (red) and its signal line (grey). The chart below reproduces the DJIA chart in the TASC article, and applies a standard MACD:
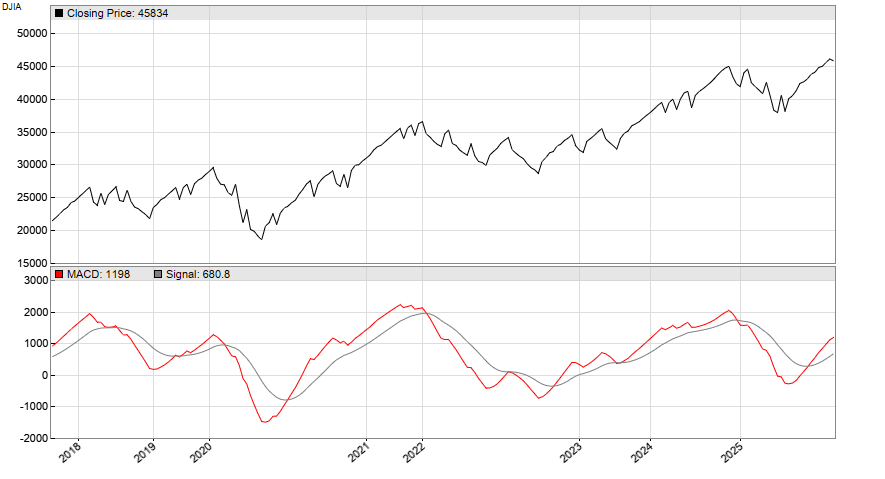
Due to the variable length of bars, the time scale on the X axis is uneven; the DJIA moved a lot more in the years 2020 and 2022 than in the other years. The code can be downloaded from the 2025 script repository.
Thanks Petra forma tour work