
Not all scripts we’re hired to write are trading strategies. Some are for data analysis or event prediction – for instance: Write me a script that calculates the likeliness of a stock market crash tomorrow. Some time ago a client ordered a script for improving the performance of their company. This remarkable script was very different to a trading system. Its algorithm can in fact improve companies, but also your personal performance. How does this work? Continue reading “Pimp your performance with key figures”
Category: Programming
Trading with REST

Many brokers and exchanges can nowadays be accessed online with a REST API that communicates with plain-text HTTP requests. The days of awkward proprietary broker APIs are coming to an end. This article is a step by step instruction of implementating a REST API interface in C for connecting a trading system to the Bittrex cryptocurrency exchange. It’s for the Zorro platform, but the principles are also valid for other exchanges and platforms. The C code for a basic REST API implementation is relatively short and straightforward. Continue reading “Trading with REST”
The COVID survival calculator
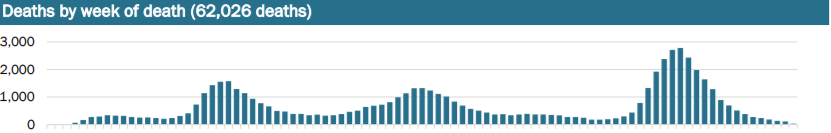
Trading is obviously affected by global pandemics. Not only because markets tank whenever a new virus variant emerges. It’s also personal. After all, if you know that you have only a few months before you likely die, you might be motivated to trade a little more risky. To help you with this decision, I’m publishing here a Zorro script that calculates your average survival time depending on the COVID incidence in your country and on your vaccination status. Continue reading “The COVID survival calculator”
Petra on Programming: Short-Term Candle Patterns

Japanese rice merchants invented candle patterns in the eighteenth century. Some traders believe that those patterns are still valid today. But alas, it seems no one yet got rich with them. Still, trading book authors are all the time praising patterns and inventing new ones, in hope to find one pattern that is really superior to randomly entering positions. In the Stocks & Commodities January 2021 issue, Perry Kaufman presented several new candle patterns. Let’s repeat his pattern tests with major US stocks and indices, and with or without an additional trend filter. Continue reading “Petra on Programming: Short-Term Candle Patterns”
Petra on Programming: Get Rid of Noise
A major problem of indicator-based strategies is that most indicators produce more or less noisy output, resulting in false signals. The faster the indicator reacts on market situations, the noisier is it usually. In the S&C December issue, John Ehlers proposed a de-noising technology based on correlation. Compared with a lowpass filter, this method does not delay the signal. As an example, we will apply the noise elimination to Ehlers’ MyRSI indicator, a RSI variant that he presented in an earlier article. Continue reading “Petra on Programming: Get Rid of Noise”
Petra on Programming: The Gann Hi-Lo Activator
Fortunately I could write this article without putting my witch hat on. Despite its name, the ‘Gann Hi-Lo Activator’ was not invented by the famous esotericist, but by Robert Krausz in a 1998 article in the Stocks&Commodities magazine. In a recent article, Barbara Star combined it with other indicators for a swing trading system. Will an indicator with the name ‘Gann’ work outside the realm of the supernatural? Continue reading “Petra on Programming: The Gann Hi-Lo Activator”
Petra on Programming: Four Dimensions of Strength
In the S&C September 2020 article “Tracking Relative Strength In Four Dimensions”, James Garofallou presents a metric for evaluating a security’s strength relative to 11 major market sectors and over several time periods. All this information is squeezed into a single value. Maybe at cost of losing other important information? In this article we’ll look into how to program such a beast, and how it fares when we use it for rebalancing a stock portfolio. Continue reading “Petra on Programming: Four Dimensions of Strength”
Petra on Programming: The Compare Price Momentum Oscillator
Vitali Apirine, inventor of the OBVM indicator, presented another new tool for believers in technical analysis. His new Compare Price Momentum Oscillator (CPMO), described in the Stocks & Commodities August 2020 issue, is based on the Price Momentum Oscillator (PMO) by Carl Swenlin. Yet another indicator with an impressive name. But has it any use? Continue reading “Petra on Programming: The Compare Price Momentum Oscillator”
Petra on Programming: Truncated Indicators
Cumulative indicators, such as the EMA or the MACD, are affected by a theoretically infinite history of candles. In finite backtests, these indicators return slightly different results depending on the test period. This effect is often assumed negligible. But John Ehlers demonstrated in his July S&C article that it is not so. At least not for some indicators, such as a narrow bandpass filter. We have to truncate the indicator’s ‘internal history’ for getting consistent results. How do we do that in C? Continue reading “Petra on Programming: Truncated Indicators”
Petra on Programming: The Correlation Cycle Indicator
The previous article dealt with indicators based on correlation with a trend line. This time we’ll look into another correlation-based indicator by John Ehlers. The new Correlation Cycle indicator (CCY) measures the price curve correlation with a sine wave. This works surprisingly well – not for generating trade signals, but for a different purpose.
Continue reading “Petra on Programming: The Correlation Cycle Indicator”