The market changes all the time. Sometimes it trends, sometimes it oscillates, sometimes it goes sidewards. Trading systems that do not react on market regime change will bring uncomfortable times for their traders (and their wallets). In TASC 7/2926, Gaetano Di Prima and Fabio Baruffa provide a solution. Their market regime filter consists of three components for detecting trend, volatility, and credit spread. Does this filter improve trading?
Although the 3 detectors are not this complex, the authors provided 9 pages Python code for realizing them. Python is an effective language, but not so for financial indicators. Neither I, nor Claude or ChatGPT did really want to convert 9 pages, so I programmed the three detectors from scratch. This took five minutes:
int marketDir(int TimePeriod)
{
  asset("SPY");
  return priceC() > SMA(seriesC(),TimePeriod);
}

int marketVolatility()
{
  return assetPrice("VIX") < assetPrice("VIX3M");
}

var marketCC(int TimePeriod)
{
  var Ratio = assetPrice("HYG")/fix0(assetPrice("IEF"));
  return zscore(Ratio,TimePeriod);
}
The assetPrice function is a helper function that returns the current price of the given asset and then switches back to the original asset. The fix0 function prevents division by zero, just in case. The first two functions return 1 when the condition is fulfilled, otherwise 0.
The authors consider the market in a favorable state when all 3 detectors give green light. If only 2 do, trading should be done with caution, and otherwise entrirely suspended. This is the code to plot a green, orange, or red bar depending on the market state:
function run()
{
  BarPeriod = 1440;
  StartDate = 2008;
  EndDate = 2026;
  LookBack = 200;
  setf(PlotMode,PL_ALL);
  assetList("AssetsIB");

  int Score = marketDir(200)
    + marketVolatility()
    + (marketCC(100) > -2);

  plot("#0",0,NEW,WHITE); // plot in a new window
  if(Score == 3)
    plot("On",1,BARS,GREEN);
  else if(Score == 2)
    plot("Caution",1,BARS,ORANGE);
  else
    plot("Risk",1,BARS,RED);}
}
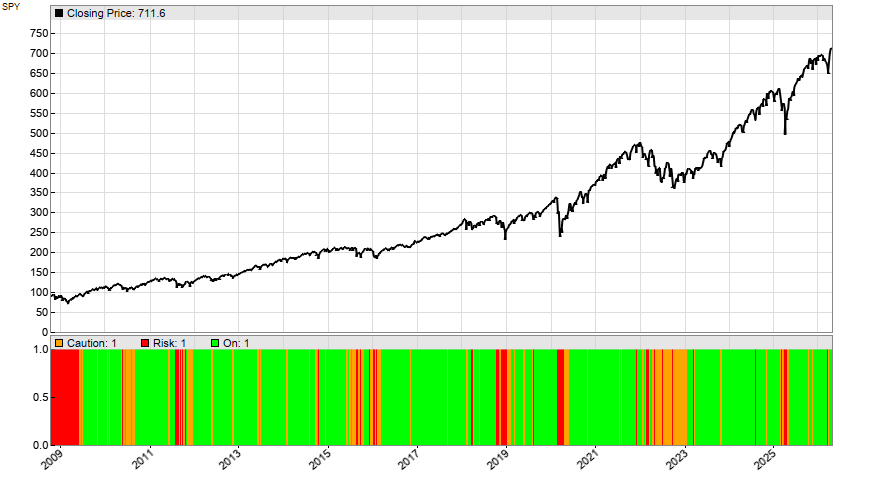
The resulting chart:
Now we’re going to put the market detector to the test. We invest all capital in SPY when the market is in a green state, half the capital in an orange state, and go out of the market in a red state. For this we add this code to the run function:
asset("SPY");
Capital = 10000;
Leverage = 1;
int Exposure = (Capital+ProfitTotal)/MarginCost;
if(Score < 3) Exposure /= 2;
if(Score < 2) Exposure = 0;

if(Exposure > LotsPool)
  enterLong(Exposure-LotsPool);
else if(Exposure < LotsPool)
  exitLong(0,0,LotsPool-Exposure);
The backtest reproduces the results from the TASC article, with 8% CAGR and 18% drawdown:
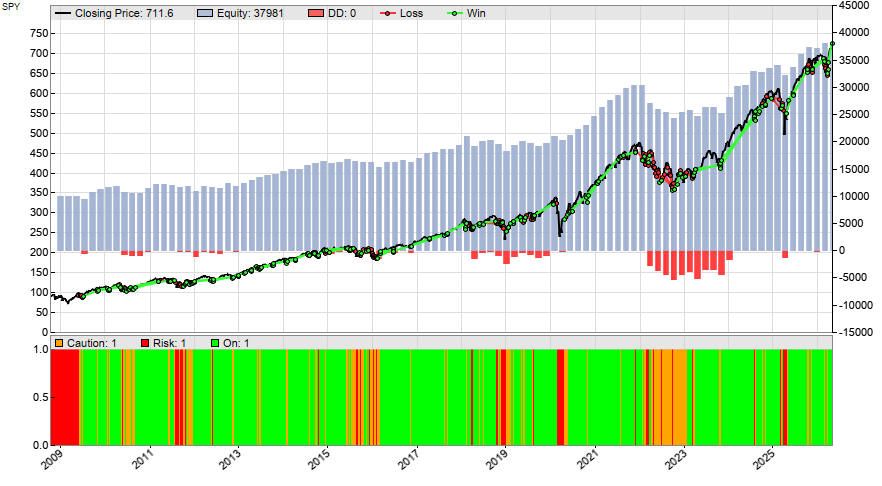
8% return is good, but not too exciting. However drawdown and risk are remarkably smaller than with a buy-and-hold strategy.
The code can be downloaded from the 2026 script repository.