Developing a successful strategy is a process with many steps, described in the Build Better Strategies article series. At some point you have coded a first, raw version of the strategy. At that stage you’re usually experimenting with different functions for market detection or trade signals. The problem: How can you determine which indicator, filter, or machine learning method works best with which markets and which time frames? Manually testing all combinations is very time consuming, close to impossible. Here’s a way to run that process automated with a single mouse click.
A robust trading strategy has to meet several criteria:
- It must exploit a real and significant market inefficiency. Random-walk markets cannot be algo traded.
- It must work in all market situations. A trend follower must survive a mean reverting regime.
- It must work under many different optimization settings and parameter ranges.
- It must be unaffected by random events and price fluctuations.
There are metrics and algorithms to test all this. The robustness under different market situations can be determined through the R2 coefficient or the deviations between the walk forward cycles. The parameter range robustness can be tested with a WFO profile (aka cluster analysis), the price fluctuation robustness with oversampling. A Montecarlo analysis finds out whether the strategy is based on a real market inefficiency.
Some platforms, such as Zorro, have functions for all this. But they require dedicated code in the strategy, often more than for the algorithm itself. In this article I’m going to describe an evaluation framework – a ‘shell’ – that skips the coding part. The evaluation shell is included in the latest Zorro version. It can be simply attached to any strategy script. It makes all strategy variables accessible in a panel and adds stuff that’s common to all strategies – optimization, money management, support for multiple assets and algos, cluster and montecarlo analysis. It evaluates all strategy variants in an automated process and builds the optimal portfolio of combinations from different algorithms, assets, and timeframes.
The process involves these steps:

The first step of strategy evaluation is generating sets of parameter settings, named jobs. Any job is a variant of the strategy that you want to test and possibly include in the final portfolio. Parameters can be switches that select between different indicators, or variables (such as timeframes) with optimization ranges. All parameters can be edited in the user interface of the shell, then saved with a mouse click as a job.
The next step is an automated process that runs through all previously stored jobs, trains and tests any of them with different asset, algo, and time frame combinations, and stores their results in a summary. The summary is a CSV list with the performance metrics of all jobs. It is automatically sorted – the best performing job variants are at the top – and looks like this:
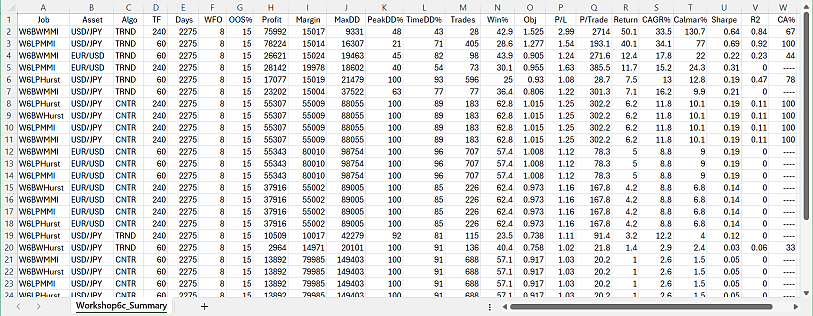
So you can see at a glance which parameter combinations work with which assets and time frames, and which are not worth to examine further. You can repeat this step with different global settings, such as bar period or optimization method, and generate multiple summaries in this way.
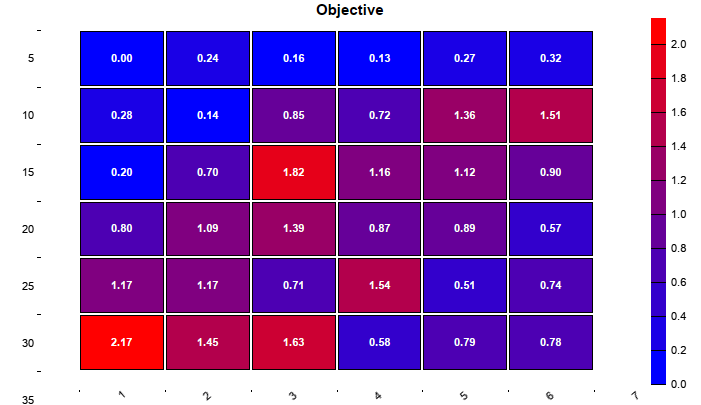
The next step in the process is cluster analysis. Every job in a selected summary is optimized multiple times with different walk-forward settings. The result with any job variant is stored in WFO profiles or heatmaps:
After this process, you likely ended up with a couple survivors in the top of the summary. The surviving jobs have all a positive return, a steady rising equity curve, shallow drawdowns, and robust parameter ranges since they passed the cluster analysis. But any selection process generates selection bias. Your perfect portfolio will likely produce a great backtest, but will it perform equally well in live trading? To find out, you run a Montecarlo analysis, aka ‘Reality Check’.
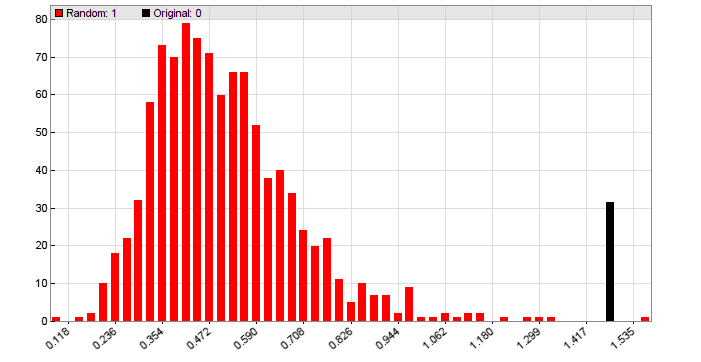
This is the most important test of all, since it can determine whether your strategy exploits a real market inefficiency. If the Montecarlo analysis fails with the final portfolio, it will likely also fail with any other parameter combination, so you need to run it only close to the end. If your system passes Montecarlo with a p-value below 5%, you can be relatively confident that the system will return good and steady profit in live trading. Otherwise, back to the drawing board.
The use case
For a real life use case, we generated algorithms for the Z12 system that comes with Zorro. Z12 is a portfolio from several trend and counter trend algorithms that all trade simultaneously. The trading signals are generated with spectral analysis filters. The system trades a subset of Forex pairs and index CFDs on a 4-hour timeframe. The timeframe was choosen for best performance, as were the traded Forex pairs and CFDs.
We used the evaluation shell to create new algos, not from a selected subset, but from all major Forex pairs and major index CFDs, with 3 different time frames from 60, 120, and 240 minutes. 29 algorithms passed the cluster and montecarlo analysis, of which the least correlated were put into the final portfolio. This is the equity curve of the new Z12 system:
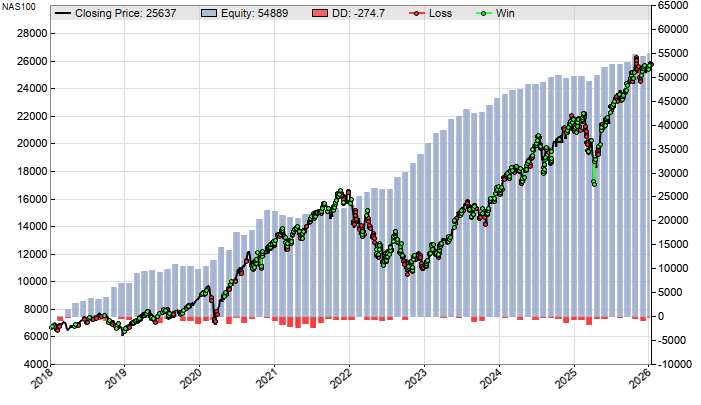
Other performance parameters, such as Profit Factor, Sharpe ratio, Calmar Ratio, and R2 also improved by more than 30%. The annual return almost doubled, compared with the average of the previous years. Nothing in the basic Z12 algorithms has changed. Only new combinations of algos, assets, and timeframes are now traded.
The evaluation shell is included in Zorro version 3.01 or above. Usage and details are described under https://zorro-project.com/manual/en/shell.htm. Attaching the shell to a strategy is described under https://zorro-project.com/manual/en/shell2.htm.
a jcl post? it must be new year!
All jokes aside, this is good stuff as usual. This series is what actually made it click for me, aside from your book. Thank you, truly.