
Enough blog posts, papers, and books deal with how to properly optimize and test trading systems. But there is little information about how to get to such a system in the first place. The described strategies often seem to have appeared out of thin air. Does a trading system require some sort of epiphany? Or is there a systematic approach to developing it?
This post is the first of a small series in which I’ll attempt a methodical way to build trading strategies. The first part deals with the two main methods of strategy development, with market hypotheses and with a Swiss Franc case study.
Strategies come in two flavors
You can use mainly two methods to develop trading systems: model-based and data-mining. A model-based system starts with a model of a market inefficiency – based on trader psychology, economy, market microstructure, or any other price affecting force. The inefficiency produces a price curve anomaly or pattern that deviates from the random walk and can – when predictive – be used for a trade algorithm. Examples of model based trading methods are trend following, mean reversion, price cycles, price clusters, statistical arbitrage, and seasonality.
The problem: A model is not the reality. It is a simplified image of it. It can not be proven and can often not even be falsified. Its validity can only be determined by its effects on the price curve. The usefulness of this method thus depends on the significance and long-term stability of its price curve anomalies. For judging this you need good test algorithms.
The pure data mining method works the other way around. It just looks for price curve patterns and attempts to fit an algorithm to them. By which market forces the patterns are caused is of no interest; only assumption is that patterns of the past will repeat in the future. This allows the generation of trade systems, often, but not always with machine learning software. The most popular methods in this approach are trial-and-error TA, candle patterns, regression, autocorrelation, k-means clustering, neural networks, support vector machines, and decision trees.
The advantage of data mining is that you do not need to care about market hypotheses. The disadvantage: those methods usually find a vast amount of random patterns and thus generate a vast amount of worthless strategies. Since mere data mining is a blind approach, distinguishing real patterns – caused by real market inefficiencies – from random patterns is a challenging task. Even sophisticated reality checks can normally not eliminate all data mining bias. Not many successful trading systems generated by data mining methods are known today.
Are you cleverer than the market?
Obviously, no trading system would work when market inefficiencies do not exist. And it would not work either when they exist, but can not be exploited since better equipped players are doing that already. In this first part of the mini-series I look into the possibility of trading better than the majority of market participants, a prerequisite of a successful strategy.
The three hypotheses of market efficiency that you’ll hear from time to time are as follows:
- Hypothesis A: The markets are efficient. Prices follow real events, such as the publication of company results, and reflect the real value of the asset. All traders are ‘informed’, decide rationally and act immediately. Price curves are mostly random-walk curves with no information for predicting future prices. Technical trading systems can not work, or if they do, it’s just luck.
- Hypothesis B: The markets are not efficient, but their inefficiencies are of no value for private traders. Only large trading firms and hedge funds can exploit them successfully, since they have lots of capital, very fast computers, very experienced analysts and very clever quants – much more intelligent than you. Beware of entering their terrain, or else you’ll become their prey.
- Hypothesis C: Enough market inefficiencies are free for you to exploit. Large trading firms and hedge funds are too slow and cumbersome to tackle them effectively. Their capital and their fast computers give them no real advantage in the game that you’re going to play. Neither do their clueless analysts, overpaid traders, and overestimated quants.
Not many today do still believe in hypothesis A. It can be easily shown that most price curves do not follow a random walk (a fellow blogger recently posted a great article about Hacking the Random Walk Hypothesis). And the markets are anything but rational or effective. Counter-examples are plenty. Jack Schwager, in his book ‘Market Sense and Nonsense’, listed cases of blatant market dumbness and grotesque analyst failures. More often than not, asset prices are far, far away from their true value. Although all this is anecdotical evidence, a pattern is visible. The markets react fast and firm when rumors or news give them a clear direction. But when the information is a little more subtle and requires a minimum of interpretation, they react slow or not at all. Here’s the story of a typical example.
The Swiss Franc case
In September 2011 the Swiss National Bank established a price cap to the Swiss Franc. Purpose was protecting the tourism and export industries against an overvalued currency. The limit was set to an EUR/CHF price of 1.20, and the SNB vowed to defend it against all enemies.
A price cap is a rare and striking market inefficiency. It can immediately be translated into a highly profitable, almost risk-free trading system (how this works is explained below). So you would normally expect a strong market reaction after the EUR/CHF price move to 1.20. But the reaction was a long time in the coming.
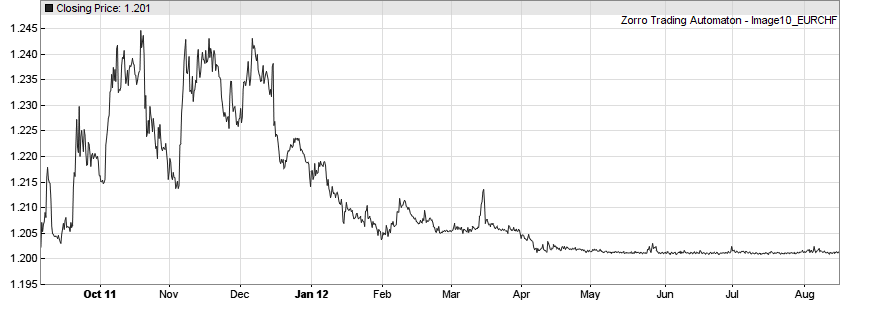
No doubt, Switzerland is an obscure European country and for the major US trading firms probably known for cheese, if at all. They did either not notice the price cap, or they had just forgotten to equip their European offices with modern communication gear. So it took the mounted messenger from Europe three months riding over hill and dale, sailing over the Atlantic Ocean, maybe fighting off brigands, pirates, and indians on his way, to reach New York City and shout: “The Swiss have a price cap!”.
But what the heck can you do with a price cap? By January 2012, large market participants had finally come up with an idea. Not something as subtle as a trading system. Instead, they began to buy mad amounts of Francs for bringing pressure on the EUR/CHF price:
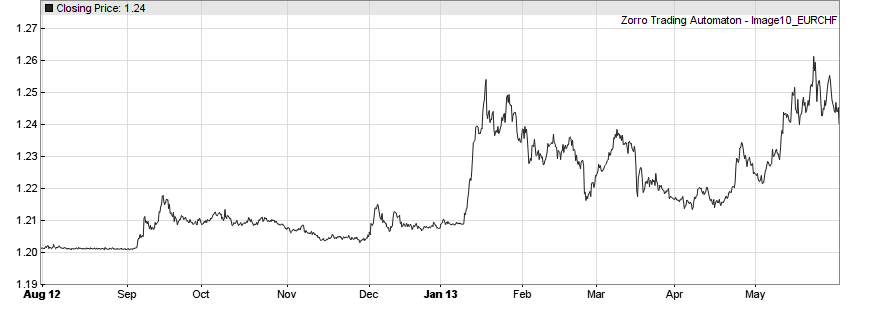
The obvious idea was that when there is a price boundary, there must be some profit in breaking it. A lot of effort, patience and money was put in that game. From May 2012 on the EUR/CHF price was nailed shut to its 1.20 limit. But alas, the price cap collapse did not happen. You do not mess with the SNB. During 2012 the Swiss erected a wall of 200 billion dollars for defending the price cap. The attackers never had a chance. The first gave up in September 2012, and by the end of January 2013 all had retreated with their tails between their legs (and probably painful losses):
Now the way was free for algorithmic systems. During the 2012 CHF battle they were forced to inactivity, since private traders and hackers lack the capital to participate in a market manipulation game. In January 2013 the first hackers started to exploit the market inefficiency with a specific method, a Grid Trader. This turned out a money-printing machine.
The money press algorithm
A grid trader is a very simple system. It places pending long and short trades at a fixed grid above and below the current price, with profit targets of the same grid distance. So trades are opened and closed whenever the price crosses a grid line in any direction. Such a system has a hypothetical 100% win rate, since trades close either in profit or not at all. But grid traders normally use a virtual hedging mechanism that closes an open position instead of opening a new one in opposite direction. This improves the total profit by reducing trade costs and margin. But it allows trades to be closed with a loss. So the real win rate of a grid trader is in the 60% area.
This is the Zorro script of such a grid trader:
// helper function to check if the grid line has no trade
bool isFree(var Price,var Grid,bool IsShort)
{
  bool result = true;
  for(open_trades) {
    if(TradeIsShort == IsShort
      && between(TradeEntryLimit,Price-Grid/2,Price+Grid/2))
        result = false;
  }
  return result;
}

// EUR/CHF grid trader main function
int run()
{
  BarPeriod = 60;
  Hedge = 5; // activate virtual hedging

  var Grid = 20*PIP; // set grid distance to 20 pips
  var Close = priceClose();

// place pending trades at 5 grid lines above and below the Close
  int i;
  for(i = Close/Grid - 5; i < Close/Grid + 5; i++)
  {
    var Price = i*Grid;
// place short trades with profit target below the current price
    if(Price < Close && isFree(Price,Grid,true))
      enterShort(1,Price,0,Grid);
// place long trades with profit target above the current price
    else if(Price > Close && isFree(Price,Grid,false))
      enterLong(1,Price,0,Grid);
  }
}
A grid trader is a typical model-based system. It assumes that some market force keeps the price inside a channel. This is the case here: The cap prevents the EUR/CHF from falling below 1.20, but it also prevents it from rising too high, since the SNB must eventually buy back all the Francs they have sold for defending the cap. The mathematical model of this would be a random walk with a 1.20 boundary and some drift term that pulls the price down. Such a constraint is a prerequisite for a grid trader; without it grid trading would be just high-risk gambling and is consequently listed in the irrational trade methods collection.
This is the P&L-curve (blue) of the above script applied to the EUR/CHF in 2013:
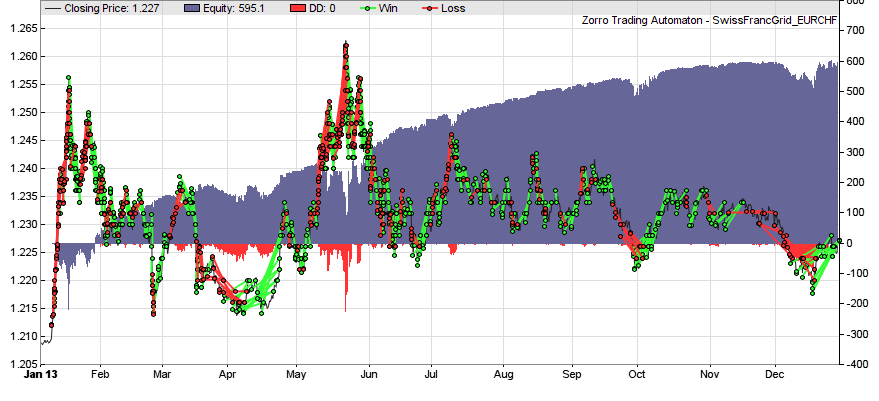
We can see that large price fluctuations, as in January and May, cause large drawdowns (the red underwater peaks in the chart). But since the fluctuations have a limit, we can estimate the maximum loss and just keep enough capital on the account. This way the above script produces an annual return of 130% and a Sharpe Ratio of 1.7 – with virtually no risk ( as long as the price cap stays in place).
The news of such a trading strategy slowly spread in 2013. More and more private traders and financial hackers, and also more and more large market participants jumped on the bandwagon. Three years after installation of the price cap, thousands of such systems sat on the EUR/CHF price curve like leeches and sucked off money. The result was a continuously falling price volatility:
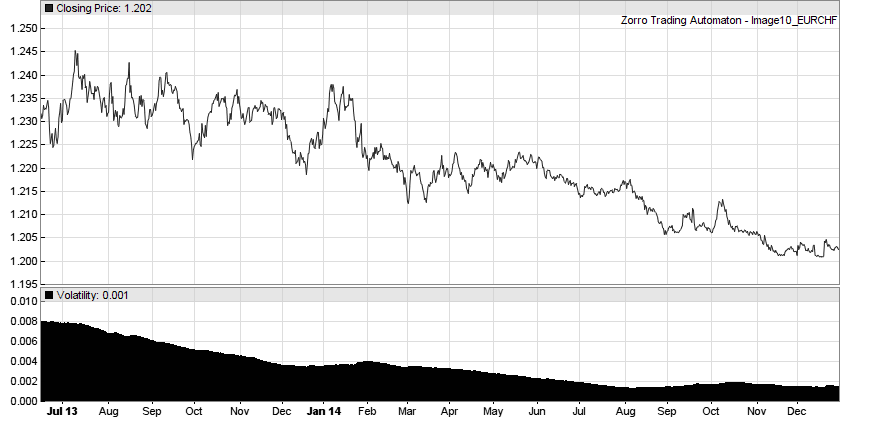
Lower volatility means lower profits to a grid trader. More capital must be invested and the grid must be tightened for compensating. But there is a natural limit. You can not have a grid size smaller than the trading costs. By autumn 2014 the volatility was close to zero. And this was accompanied by an ominous price downwards drift, as if some large market participant (possibly the SNB itself) would continously sell EUR and buy CHF in anticipation of some future event. That would have been high time for private traders to retreat from the game. Of course, thickheads like me didn’t. It is well known what then happened to the Swiss Franc:
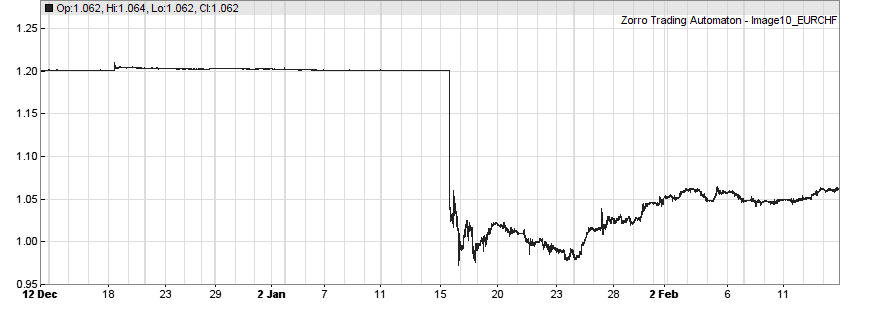
In the morning of 15 January 2015, the SNB gave a press conference and announced the cancellation of the price cap. The EUR/CHF fell in minutes like a stone from the 1.20 limit to below parity. Obviously a fast and extreme market reaction – very different to the introduction of the price cap 4 years before. The price drop killed many accounts and even a few brokers. By the way, the ‘real value’ of the EUR/CHF, based on the relative buying power of the two currencies, was in the 1.50 area all the time.
What can we learn from this and from similar examples?
Conclusions
- The financial markets react immediately and often hysterically on news with a clear price upwards/downwards direction.
- The markets react slow or not at all on more subtle information. It can take years until they become aware of new inefficiencies or trading methods.
- The markets prefer brute-force methods. Complex strategies are normally only used by a small part of market participants.
- Simple systems based on very obvious inefficiencies can be extremely profitable, but have a limited lifetime.
The next parts of the Build Better Strategies series will deal with model-based systems, with known market inefficiencies and with a methodical approach of exploiting them.
Excellent post as all of yours. Just a comment, thickhead and trading are not well suited.
“Not many successful trading systems generated by data mining methods are known today.” , hence the need to apply data mining technique to a well known market model , like trend following, mean reversion, etc.
Excellent article on Building Trading Systems as always. Liked it very much.
I have an exiting trading system/strategy (in MT4 EA format), what are the possible steps/software etc I can use to improve the EA’s performance? Is there any good backtester cum optimisation tools you would recommend?
Sure, convert your strategy to C, select the parameters to optimize and then do a walk forward test with Zorro.
Great article. However, I don’t quite understand the grid trader strategy, could you explain a little to me?
So, essentially you are betting that the price will be locked in a channel, meaning having a floor and a ceiling. Thus, you set up several equal distance grids, when price rise up and cross the upper halves of the grid lines you set up, you short them at each grid line and set up a stop win at exactly one grid line width, right? When price goes down, you do exactly the opposite thing. Go long 1 unit when price cross down a grid line with a stop win of 1 grid line width.
Essentially this is a mean-reverse strategy, right?
Yes, it is a mean reversing system that requires the price to eventually go back to its origin. It places long and short trades at any grid line with no stop and with TP at the next grid line. The system has 100% win rate until it bites the dust when the price move exceeds the capital. On the Internet are many descriptions of this system or variants of it, by people who think they found the holy grail.
There is definately a great deal to find out about this subject.
I really like all of the points you have made.