
In this second part of the Algorithmic Options trading series we’ll look more closely into option returns. Especially into combining different option types for getting user-tailored profit and risk curves. Option traders know combinations with funny names like “Iron Condor” or “Butterfly”, but you’re not limited to them. With some tricks you can create artificial financial instruments of any desired property – for instance “Binary Options” with more than 100% payout factor.
The profit diagram of an option is its profit or loss at or before expiration in dependence of the price of the underlying. Let’s assume that we know that the price of a certain asset will rise in the next months. So we buy a call option on that asset. Our profit diagram then looks like this:
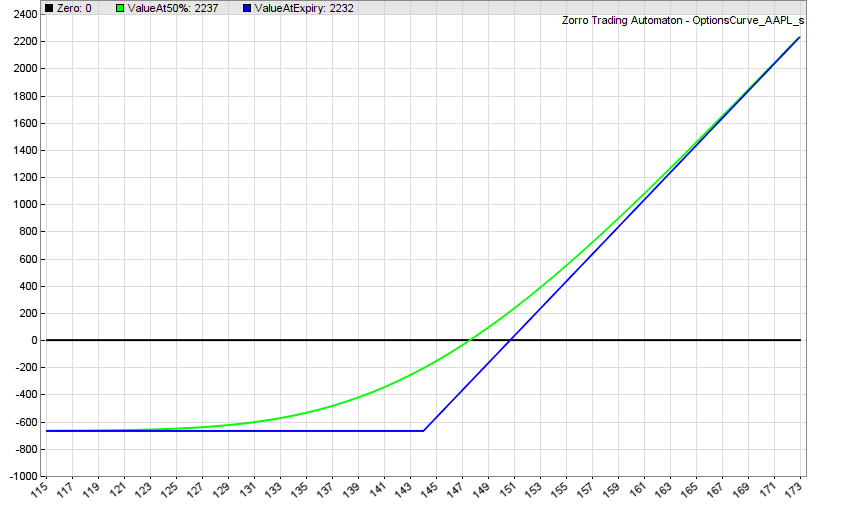
This is the potential return when buying a current (June 2017) AAPL call option with 4 months expiration time. We have to pay $668 premium for that option. The current AAPL price is $144, and that’s also our strike price. The blue line is our profit or loss, dependent on the AAPL price at expiration. The option will expire out of the money when AAPL stays below $144, so we’ll then lose the premium. We’ll still lose a part of the premium if the option expires only slightly in the money. The break even point is at about $151. And if AAPL floats even higher at expiration time, we can collect huge profits of a multiple of the premium. So buying a call option means an unlimited profit chance at a limited risk. You can not lose more than the premium.
The green line in the diagram is the theoretical option value after 2 months, at half the expiration time. It is approximated with a finite difference method or calculated with the Black-Scholes formula, dependent on option type. The real option price is normally close to that theoretical value. So we can see that we could already sell the option with a profit after two months when the AAPL price is then above $148.
By the way, this option profit diagram resembles the response function of a Rectified Linear Unit in a neural network. So we can speculate that when a billion option traders permanently sell and buy large numbers of options, when the underlying price depends on option demand, and when profits are always reinvested in new options, the option market becomes a huge neural net. Some day artificial intelligence might emerge and the options start buying and selling themselves…
Option combos
Now let’s assume we know for sure that the AAPL price will move in the next time, but we do not know if it will rise or fall. For making profit in both cases, we just buy a call and a put option, both with the strike at the current price of $144:
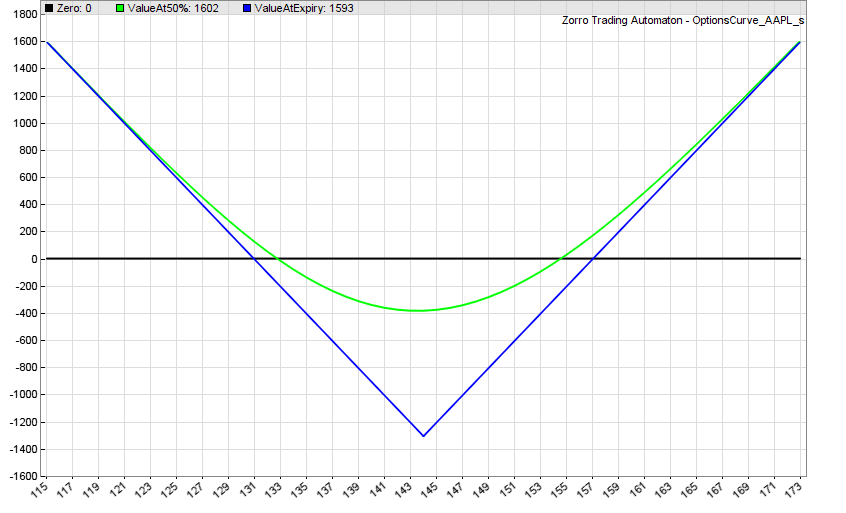
We can see that a call and a put option with the same parameters don’t cancel out each other! The resulting profit diagram is just the sum of the profit diagrams of the single options. For both options we have to pay a $1310 total premium. If the AAPL price stays inside the $131 – $157 range, we lose. If it ends up outside this range, we win. If it ends up outside by a wide margin, we win big.
Now suppose we think an asset won’t be very volatile in the next time and its price will stay inside a range. We’ll then sell the two options instead of buying them. Selling instead of buying just turns the above profit diagram upside down. And we can already see the problem with that: The profit is now limited and the risk unlimited.
For fixing this, we need to add some more options to the combination:
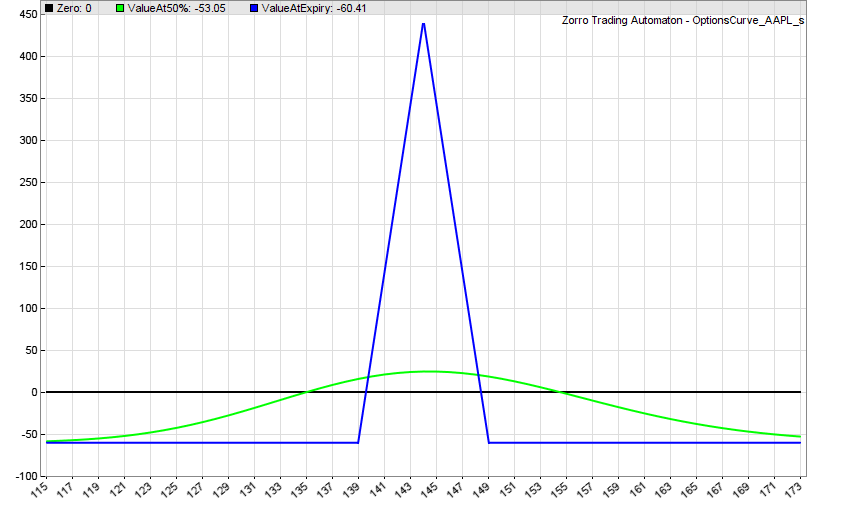
For this profit diagram we’ve used 4 options. We bought one call at a strike $5 below the current price, another call at a strike $5 above the current price, and we sold short two calls with the strike at the current price. For the two long options we paid $1400 premium, and for the two short options we got $1340. This leaves us with $60 total premium cost, and a chance of up to $440 profit when the price stays inside the $140 – $148 range. This option combo, for whatever reason, got the name “Long Butterfly” by option traders.
By the way, you can see from this butterfly that you can really produce any profit diagram with a suited combination of options. The position of the butterfly peak is determined by the strike prices, its width by their distance, its height by the number of options. This way, many different butterfly peaks can be theoretically put together to a profit diagram of any shape. Unfortunately, you cannot just as freely determine its vertical position – a part of the diagram will be always below the zero line…
The code
Here’s a small C script (for Zorro) for experiments with all sorts of option combinations:
#include <contract.c>
void optionAdd(int Num,int Type,var StrikeOffs);

#define ASSET     "AAPL"
#define EXPIRY	  120	// 4 months
#define BUY	(1<<10)
#define SELL	(1<<11)

void combo() // "Butterfly"
{
	optionAdd(1,BUY|CALL,-5);
	optionAdd(2,SELL|CALL,0);
	optionAdd(1,BUY|CALL,5);
}

//////////////////////////////////////////////////
#define POINTS 100
var OptionGains[POINTS],OptionVals50[POINTS];
var UnderL,HistVol;

void optionPlot(int Num,CONTRACT* C,var Premium,var RangeMin,var RangeMax)
{
	PlotScale = 10;
	var Step = (RangeMax-RangeMin)/POINTS;
	Step = round(Step+0.5,1); // round up
	RangeMin = round(RangeMin,1);

	int i;
	for(i=0; i<POINTS; i++)
	{
		if(Num == 0) {
			OptionGains[i] = OptionVals50[i] = 0;
		} else {
			var Price = RangeMin + i*Step;
			if(Price > RangeMax) break;
			var Gain = 0;
			var Strike = C->fStrike;
			var Val50 = contractVal(C,Price,HistVol,0,0);
			switch(C->Type&(BUY|SELL|CALL|PUT)) {
				case BUY|CALL:
					if(Price > Strike) Gain = Price - Strike;
					Gain -= Premium;
					Val50 -= Premium;
					break;
				case BUY|PUT:
					if(Price < Strike) Gain = Strike - Price;
					Gain -= Premium;
					Val50 -= Premium;
					break;
				case SELL|CALL:
					if(Price > Strike) Gain = Strike - Price;
					Gain += Premium;
					Val50 = Premium - Val50;
					break;
				case SELL|PUT:
					if(Price < Strike) Gain = Price - Strike;
					Gain += Premium;
					Val50 = Premium - Val50;
					break;
			}
			OptionGains[i] += Multiplier*Num*Gain;
			OptionVals50[i] += Multiplier*Num*Val50;
			plotBar("Zero",i,0,0,LINE,BLACK);
			plotBar("ValueAt50%",i,Price,OptionVals50[i],LINE|LBL2,GREEN);
			plotBar("ValueAtExpiry",i,Price,OptionGains[i],LINE|LBL2,BLUE);
		}
	}
}

void optionAdd(int Num,int Type,var StrikeOffs)
{
	CONTRACT C;
	C.Type = Type;
	C.Expiry = EXPIRY;
	C.fStrike = round(UnderL+StrikeOffs,1);
	var Premium = contractVal(&C,UnderL,HistVol,0,0);
	C.Expiry = EXPIRY*0.5; // for the value at 50% expiration
	optionPlot(Num,&C,Premium,0.8*UnderL,1.2*UnderL);
}

void run()
{
	BarPeriod = 1440;
	StartDate = NOW;
	set(PRELOAD);
	if(is(INITRUN)) {
		initRQL();
		assetAdd(ASSET);
		assetHistory(ASSET,FROM_GOOGLE);
		asset(ASSET);
	}
	vars Close = series(priceClose());
	HistVol = Volatility(Close,20);
	UnderL = Close[0];
	Multiplier = 100;

	if(!is(LOOKBACK))
	{
		optionAdd(0,0,0); // reset the graphs
		combo();
		quit("Ok!");
	}
}
This script plots the above diagrams. The core of the script is the combo() function at the begin. It contains one or several optionAdd calls that get as parameters the number of options, the type (BUY, SELL, CALL, PUT, EUROPEAN, BINARY), and the strike difference to the current price. In the example above you can see the combination for the long butterfly. The asset and expiration can be set up in the #define lines above. The script downloads the current asset prices from Google and calculates the volatility that is needed for getting the options values and premiums. For running it you need Zorro, R, and the RQuantLib package from https://cran.r-project.org/bin/windows/contrib/3.3/RQuantLib_0.4.2.zip.
Some more examples of popular option combos:
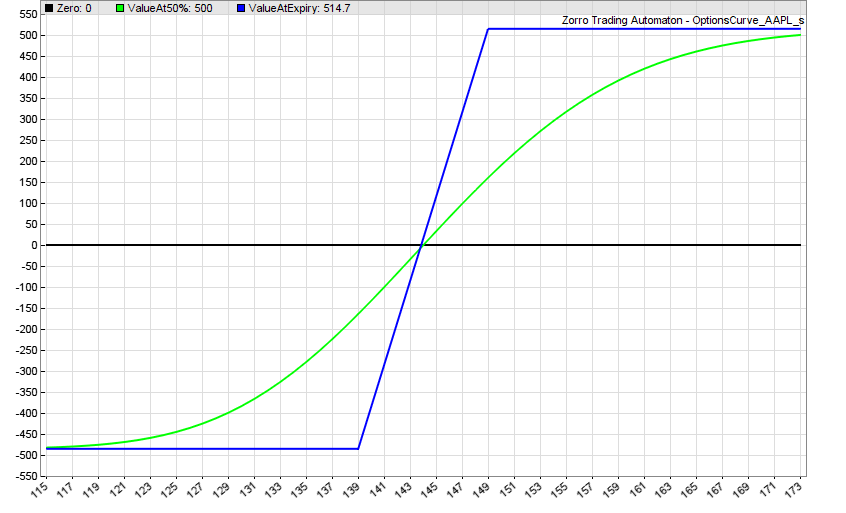
// Call Spread
void combo()
{
	optionAdd(1, BUY|CALL, -5);
	optionAdd(1, SELL|CALL, 5);
}
// Put Spread
void combo()
{
	optionAdd(1, BUY|PUT, 5);
	optionAdd(1, SELL|PUT, -5);
}
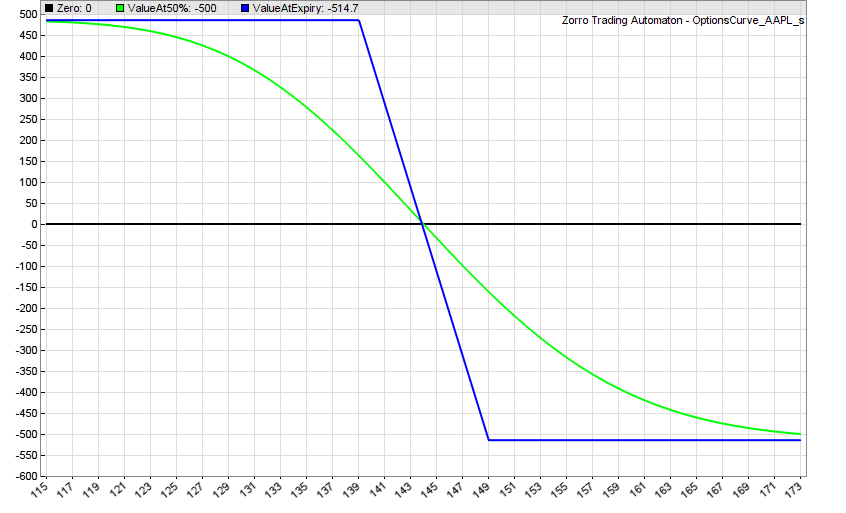
Call or Put Spreads limit our risk as well as our profit to a fixed amount. The steepness of the center slope can be controlled with the strike difference. We can see from the diagrams that Spreads are (almost) equivalent to binary options – but with a much better payout factor. The diagrams are not completely symmetrical, and the Call Spread above has $514 potential profit and $486 potential loss – equivalent to a binary option with 105% payout. If the asset has the same likeliness of going up and going down, a Call Spread gives us a statistical advantage similar to the seller’s advantage of single options. With a Put Spread it’s the other way around.
The green line shows us whether it makes sense to sell the combo prematurely. Suppose we learned that the new iPhone tends to sudden explosions, and opened an AAPL Put Spread. When the AAPL price goes down and falls below $120 after 2 months, it makes no sense to wait until expiration, since the green line at 120 has almost the same value than the blue line. Only problem is that selling reduces our profit by the bid/ask spread and commission. An option expiration has no bid/ask spread and, if out of the money, also no commission.
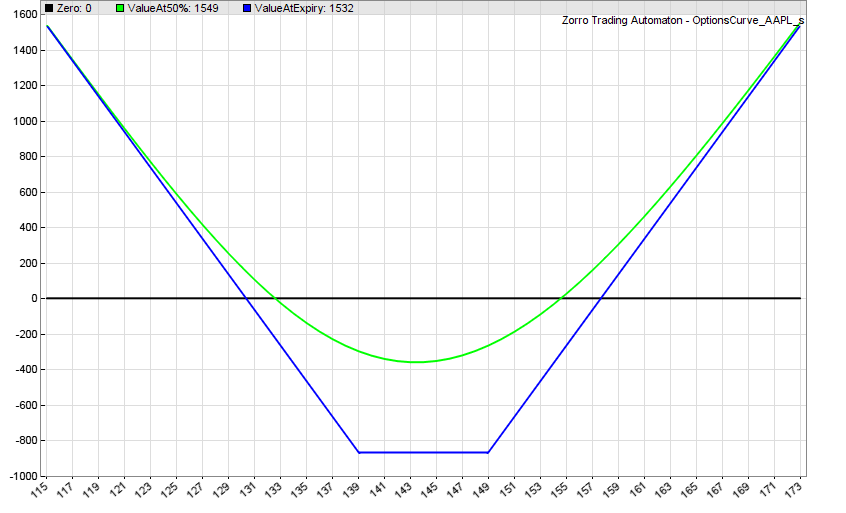
Some more combos:
// Strangle
void combo()
{
	optionAdd(1, BUY|CALL, 5);
	optionAdd(1, BUY|PUT, -5);
}
// Condor
void combo()
{
	optionAdd(1, BUY|CALL, -10);
	optionAdd(1, SELL|CALL, -5);
	optionAdd(1, SELL|CALL, 5);
	optionAdd(1, BUY|CALL, 10);
}

Combos that involve both selling and buying options – such as Spreads, Condors, or Butterflys – are especially attractive. Their investment is only the difference of the premiums, and the broker’s margin requirement is also accordingly smaller due to the limited risk. This allows trading with small capital and high leverage.
Get rich quick
Here’s my today’s get-rich-quick tip, this time for brokers. The problem with options is that you often need to wait weeks, months, or years until they finally expire and you can book your profit. Dear brokers, how about opening a market for short-term options? Options that expire at the end of each trading day, with strike prices in steps of cents, not dollars? Those options would be a very interesting instrument especially for short-term algorithmic trading. They would become very popular and produce a lot of commissions. Of course, 10% of those commissions are mine. I just patented this concept. Contact me for license conditions.
Conclusion
- Options can be clever combined for reducing the investment, limiting the risk, increasing the leverage, and generating profit diagrams of any shape.
- Depending on premiums, profit diagrams are often not perfectly symmetrical. This results in a statistial advantage (or disadvantage) of option combos with nondirectional assets.
I’ve included the OptionsCurve script in the 2017 script repository. Since price data download from Google rather than Yahoo was only recently implemented, you’ll need Zorro 1.59 or above. You’ll also need R and the RQuantLib package. In the final article of this series we’ll test a real options trading strategy.
Thanks for the article and all your work! Much appreciated!
where is the full code?(or where is the repository?)
On the top right under “download”.
Thanks, waiting for part 3
When will be aviable the next part?
Do you have any interest in implementing in python?
Not really. It would be relatively easy to implement the above diagram script in Python, but this is not so for the upcoming option trading system and for most other scripts on this blog. Python is too slow.
Hi,
I’m very interesting and would like to use Zorro to trade SPX spreads.
But is it possible to send complex contracts (combo ) of options spread as one order – eg butterfly 4 options as one order directly to eg CBOE book ?Maybe it will be possible in some new ver ? – as I found in planned features “Artificial assets from a linear combination of real assets, for basket trading or multi-asset arbitrage.” ?
What about backtesting using mid price of bid/ask +- some offset – in SPX one almost never trade on ask or bid price (spread is very wide)?
Thanks,
How combos are sent depends on the broker API plugin, but as to my knowledge, the current IB plugin sends them as separate orders, not as a single order.
The backtest uses the historical ask and bid prices. So for using the mid prices plus offset, you must modify the historical data accordingly with some small script.
As of my knowledge IB API send orders (from our side to IB servers) with contract definition, contract could be a single asset or combo (list of combo legs, and ids of legs assets, direction in combo, quantity etc).
this is example of option credit spread order API message :
20:36:11:949 <- 3-45-506-0-USD-BAG–0—SMART–USD—–BUY-1-LMT–1.15–DAY—O-0–0-0-0-0-0-0-0-0-2-277697435-1-SELL-SMART-0-0–0-277697438-1-BUY-SMART-0-0–0-0-0–0——–0—1-0—0—0-0–0——0—–0———–0—0-0—0–0-0-0-0–1.79769313486232E+308-1.79769313486232E+308-1.79769313486232E+308-1.79769313486232E+308-1.79769313486232E+308-0—-
Than IB sends it (internally) as a one order or many orders to exchange/es – depending of routing (smart or direct) and if it is guarantee or not and if combo/block orders are allowed on exchange of choice.
I trade SPX options that are trading only on one exchange (CBOE) so if we send combo and exchange rules are met it is traded as block trade not single options with their own rules (eg min price increment different than separate options) .
Sending separate orders could be risky especially in fast market. Separate options has usually much biggest delta than combo built from it, even small latency in trading it separately could cause losses.
So my question is: Can Zorro build this combo contract and send it through IB API as one order ?
Regards,
Andrew
As I said, they are sent as separate orders. But you could contact Zorro support and inquire about implementing combo orders for the IB API, or suggest that as a future feature.
Very nice article!!
Just discovered this site. Great content. Have you investigated these strategies with the cryptocurrency markets? I finally got around to reading the MIT paper, Bayesian regression and Bitcoin (Shah,Zhang), and it seems like a fun algorithm to try to implement (100% return in 60 days isn’t entirely offensive, either). Anyway, looking forward to exercising Zorro. Thanks for taking the time to post!
@jcl, Why aren’t you rich?
How have you found out that I’m not rich?
For the record, I am finishing up writing the Ally Invest plugin, and it will have the multi-leg options feature upon release. You only pay the fixed commission once instead of – say – four commissions for four trades. (Per-contract fees still apply.) So you will be able to re-create any combo in this article with one trade.
I’ve tried this code and am not getting exactly the expected answers. It appears that the Premium is not being calculated so the lowest points on the graph are at zero rather than below to show a potential loss.
I’m running 1.59 beta and RTest works properly.
Any thoughts?
Works here. The premium is calculated by the RQuantlib library, so make sure that you’ve correctly installed it from the link in the Zorro manual, and that you’re using the current Zorro beta, I believe it’s 1.59.95. – @Andrew: that sounds good. You’ll probably find many interested beta testers for the plugin on the Zorro user forum. Let us know how it’s coming along.
Using DebugView, I found that this requires the package Rcpp to be installed.
jcl: I think I’ll have it in beta by next week. Look forward to it!
Andrew
looks like the code for the condor script is incorrect. You have call 4 times, but it should be buy/sell call and buy/sell put.
I am currently looking for someone to code an options/futures trading strategy with. I know markets but no algo programming experience and no time to learn.
The methodology is profitable and very straightforward (not rocket science). Would like to joint venture on back-testing it and licensing it to some of my trading contacts. We split profits.
JCL… or you could point me in the direction of some fellow programmers with options algo experience who might be interested in latching onto a proven profitable methodology.
The condor was indeed incorrect, thanks for pointing this out. AFAIK this was fixed in the latest optionscurve script for part 3 of the series. And the best options strategy programmer that I know is my colleague Richard – you can contact him under info(at)opgroup.de. But he won’t work for split profits.
High Frequency and Algo Trading are Taking Over Markets – What It Means For You
https://www.cityfalcon.com/blog/investing-for-newbies/high-frequency-algo-trading-taking-over/?utm_campaign=ao_financial-hacker
A math-heavy paper with interesting title:A Universal Model for Pricing All Options https://papers.ssrn.com/sol3/papers.cfm?abstract_id=3007314
Hi,
I did the following but I’m still getting the error in the Zorro console “Can’t run R!” followed by “Error – can’t start R!”
1. Installed Zorro 2.257
2. Installed R 4.0.2
3. Installed the RQuantLib library using the R GUI for Windows “Packages” > “Install Packages”
4. Selected RQuantLib and installed it. This installation automatically installed Rcpp and zoo libraries
What am I missing?
If you need help with Zorro or R, you can ask on their user forums or contact their support.
Hi jcl,
Thanks for pointing me to the Zorro forum.
By referring to https://opserver.de/ubb7/ubbthreads.php?ubb=showflat&Number=472919&Searchpage=1&Main=57228&Words=%2BRQuantLib&Search=true#Post472919, I got to know that I had to change the the path to Rterm in the Zorro.ini file. Once I did that, it worked like a charm 🙂
Thanks again!
Hi,
I want to sell a Straddle (same expiry and same strike)
Here is the relevant code:
Multiplier = 100;
put_leg = contractNext (PUT, Expiry, priceClose()*-1);
call_leg = contractNext (CALL, Expiry, priceClose()*-1);
t1=enterShort(comboLeg(1));
t2=enterShort(comboLeg(2));
pnl = comboProfit ( priceClose() , -1);
However the Output looks strange:
Put Undl:5316.6 Strike:5315.0 ask:3.100 bid 2.900 / 2nd Leg: Call Strike:5315.0 ask:5.600 bid 5.250
Combo 7, NumOpenTotal 1, ComboPremium -8.70, PnL: -7.10, Margin 402.82
As I sell (short) the straddle I would expect the Premium to be positive and the comboProfit too, actually it is negative.
Additionally the comboProfit is quite off, I would expect it to be either 8.7 (ask delta) or 8.4 (mid Delta).
Can someone point me to a solution.
Questions like this are better directed to Zorro support. You can find the formula for calculating the PnL of a combo in the manual. A negative price generally means you don’t pay it, but get it.
Isso funciona pra corretoras de OB como quotex,bullex ou pocket broker,amigo?
The “financial hacker” angle resonates—I got tired of generic bots missing XAUUSD’s structural moves around support/resistance, so I built a custom scalper using Ratio X EA Generator instead of wrestling with MQL5 syntax. Described my exact entry logic, ATR-based stops, and prop firm drawdown limits in plain English, and the AI pipeline generated clean, backtestable code in minutes. The generated EA is solid and I own it outright—no subscription nonsense. Have you found any off-the-shelf algos that actually respect gold’s geopolitical volatility, or are custom builds the only way?