
In his TASC February 2023 article, John Ehlers proposed to use the average of open and close, rather than the close price, for technical indicators. The advantage is a certain amount of noise reduction. On intraday bars the open-close average is similar to an SMA(2). It makes the data a bit smoother, but at cost of additional lag by half a bar.
The script below, in C for the Zorro platform, compares the standard RSI with the open-close average RSI on the S&P 500 index with 15-minute bars:
void run()
{
  BarPeriod = 15;
  StartDate = 20220629;
  EndDate = 20220712;
  asset("SPX500");
  vars OC = series((priceO()+priceC())/2);
  plot("RSI(Close)",RSI(seriesC(),14),NEW,RED);
  plot("RSI(OC)",RSI(OC,14),0,BLUE);
}
We can indeed see some noise reduction in the resulting chart:
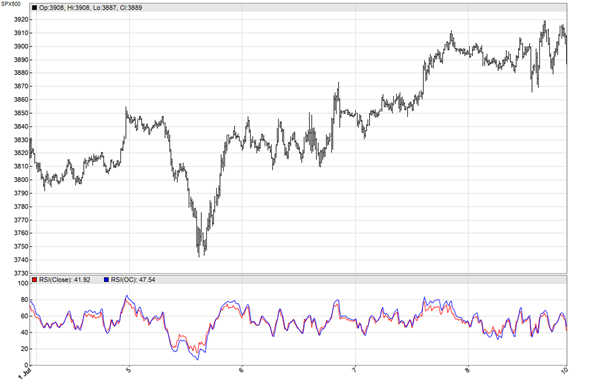
The obvious question: Will the smoother curve compensate for the additional lag in a trading system? For testing this, I added the following 5 lines to the script:
vars RSIs = series(RSI(OC,14));
if(crossUnder(RSIs,70))
  enterShort();
if(crossOver(RSIs,30))
  enterLong();
That’s a simple RSI trading system: Enter a short position when the RSI crosses below 70, and enter a long position when it crosses above 30. Any position is closed when an opposite position is opened. I found indeed that that using the open-close average produced a better result with some instruments and time periods, but a worse result with others. There was no clear tendency. However, it’s certainly worth a try when you’re anyway developing an indicator based trading system.
The script can be downloaded from the 2023 script repository.
On first quick attempts – not finding a good use for this.
I think Ehlers changed his SuperSmoother (and maybe others) to transform the input series with the average of the previous sample: (src+src[1])/2. The idea of this article is roughly the same.
To me it’s not evident it helps significantly, but cool easy trick.