Perry Kaufman, known for his technical indicators bible, presented in TASC 1/24 a trading strategy based on upwards and downwards gaps. For his system, he invented the Gap Momentum Indicator (GAPM). Here I’m publishing the C version of his indicator, and a simple trading system based on it.
The indicator is a straighforward conversion of Kaufman’s EasyLanguage code to C:
var GAPM(int Period, int SignalPeriod)
{
    var UpGaps = 0, DnGaps = 0;
    int ix;
    for(ix = 0; ix < Period; ix++) {
        var Gap = priceO(ix) - priceC(ix+1);
        if(Gap > 0) UpGaps += Gap;
        else if(Gap < 0) DnGaps -= Gap;
    }
    var GapRatio = ifelse(DnGaps == 0,1,100*UpGaps/DnGaps);
    return SMA(series(GapRatio),SignalPeriod);
}
The system trades QQQ, a NASDAQ ETF. The historical data for the backtest is loaded from Yahoo. It enters a long position when upward gaps are on the rise, and closes the position otherwise. The code in C for the Zorro platform:
function run()
{
    StartDate = 2011;
    EndDate = 2023;
    BarPeriod = 1440;
    Fill = 3;    // trade on next open
    var Investment = 100000;
    assetAdd("QQQ","YAHOO:*");
    asset("QQQ");
    vars Signals = series(GAPM(40,20));
    if(!NumOpenLong && rising(Signals))
        enterLong(Investment/priceC());
    if(NumOpenLong && falling(Signals))
        exitLong();
}
The resulting equity curve:
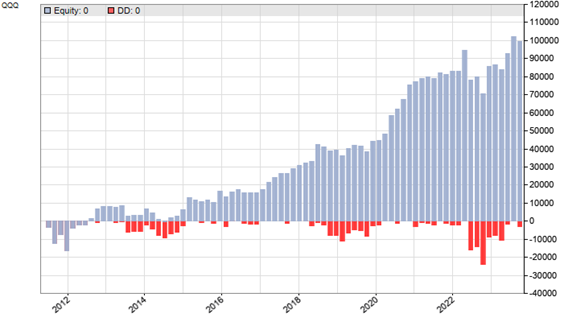
The result is not sensational, but the system achieved a solid 12% return on investment, well above buy-and-hold, with 56% winning trades. The GAPM indicator and the trading system can be downloaded from the 2023 script repository.
Thanks for sharing this. Very insightful.
Question: did you mean “Perry” Kaufman? And by ‘Technical Indicator Bible” did you mean his book: “A Short Course in Technical Trading”?
Thanks in advance.
Yes, Perry Kaufman, sorry for the typo. With the bible I meant the 1100 pages ‘New Trading Systems and Methods’.
thanks for this. in the equity curve above, it shows a return of $90,000 , which is a lot more than the stated “12% return on investment” that you mention in the text. Is this the right equity curve?
Please disregard my previous comment. I realized the initial capital was 100,000.
A more pressing question is about beating buy and hold. It seems that if one bought+held QQQ from 2011 to 2023, the return would have been more like 370%, going from ~$60 to ~$280. The strategy would have to beat a 370% return, so 12% wouldnt be a beat.
Index ETFs like SPY or QQQ are in the area of 5% to 15%, not 370%. 12% would beat the index when it is combined with smaller volatility. The best portfolio rotating systems produce about 20%, so the Gap Momentum system is not in the top area.
Thanks again, but I think we may have a misunderstanding.
Are you referring to CAGR?
Because returning 12%, or even 20% over the entire duration of 11 years doesn’t seem to be a noteworthy return at all.
Physically buying and holding QQQ over that time period will clearly net way above 12% from the time of the buy through the duration of the hold.
The CAGR is indeed the normal metric, but in this case the ROI is used because capital is not re-invested. The misunderstanding is simply that you were confusing the end value with the annual return. Financial performance metrics are annual averages. The difference of some start and end value is not very meaningful.
Thanks for clarifying, this makes more sense. I appreciate the responses as I am a rookie.
On the calculation, how are you calculating average annual ROI for QQQ? My quick calculations show ~38%.
If you could share the formula or source that would be really helpful.
Thanks Petra for again this excellence post. I am using your codes as a basis for my own development quite often. I do learn a lot from your coding.
Actually Perry Kaufmanns bible is a lifetime work for testing his ideas.
Martin