
Price charts normally display price over time. Or in some special cases price over ranges or momentum. In his TASC articles in June and July 2022, John Ehlers proposed a different way of charting. The relation of two parameters, like price over momentum, or price A over price B, is displayed as a 2D curve in a scatter plot. The resulting closed or open loop is supposed to predict the future price development. Of course only if interpreted in the right way.
For his loop chart, Ehlers filtered the low and high frequencies out of the two data series with a roofing filter. Its code in C for Zorro:
var Roofing(var *Data,int HPeriod,int LPeriod)
{
  var f = 1.414*PI/HPeriod;
  var hpa1 = exp(-f);
  var hpc2 = 2*hpa1*cos(f/2);
  var hpc3 = -hpa1*hpa1;
  var hpc1 = (1 + hpc2 - hpc3) / 4;
  f = 1.414*PI/LPeriod;
  var ssa1 = exp(-f);
  var ssc2 = 2*ssa1*cos(f/2);
  var ssc3 = -ssa1*ssa1;
  var ssc1 = 1 - ssc2 - ssc3;

  vars HP = series(0,3);
  HP[0] = hpc1*(Data[0] - 2*Data[1] + Data[2]) + hpc2*HP[1] + hpc3*HP[2];
  vars SS = series(HP[0],3);
  SS[0] = ssc1*(HP[0] + HP[1])/2 + ssc2*SS[1] + ssc3*SS[2];
  var Scaled = EMA(SS[0]*SS[0],.0242);
  return SS[0]/sqrt(Scaled);
}
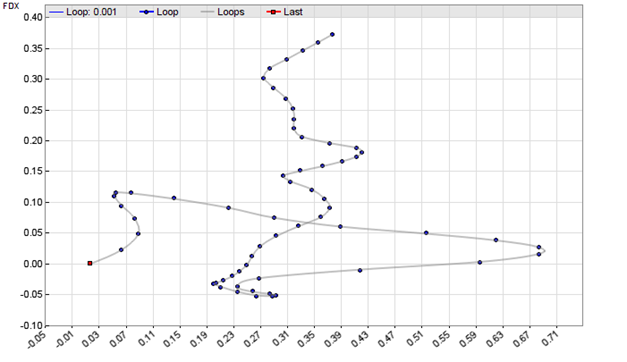
For demonstration purposes we apply that filter to the FDX price and volume series. The filtered data points serve as XY coordinates for our curve – the “Ehlers Loop”. The following script reads 3 months stock data from an online source and displays it in a scatter plot where the XY points are connected with splines:
function run()
{
  StartDate = ymd(wdate(NOW)-90); // 90 days before today
  BarPeriod = 1440;
  asset("FDX");
  var PriceRMS = Roofing(seriesC(),125,20);
  var VolRMS = Roofing(series(marketVol()),125,20);

  if(is(LOOKBACK)) return; // don't plot the lookback period
  plotGraph("Loop",VolRMS,PriceRMS,DOT|GRAPH,BLUE);
  plotGraph("Loops",VolRMS,PriceRMS,SPLINE|GRAPH,TRANSP|GREY);
  if(is(EXITRUN))
    plotGraph("Last",VolRMS,PriceRMS,SQUARE|GRAPH,RED);
}
The plotGraph function is used to display each coordinate with a blue dot. The last day is marked with a red square.
Ehlers intended his loops for discretionary trading, but it can of course also be automated. For instance, the last N coordinates could be used as inputs for Zorro’s neural net, which can then be trained to predict tomorrow’s price. Or even simpler, the slope of a polynomial regression through the last points could trigger a buy order when positive, or a sell order when negative. You can use Zorro’s polyfit function and filter with the regression error. I leave this trading system as an exercise to the reader.
The same method can be used to compare a stock with an index for a pairs rotation strategy. We’re using RTX and SPY:
function run()
{
  BarPeriod = 1440;
  LookBack = 300;
  StartDate = 20210801;
  EndDate = 20211130;

  assetAdd("RTX","YAHOO:*");
  asset("RTX");
  var Y = Roofing(seriesC(),125,20);
  assetAdd("SPY","YAHOO:*");
  asset("SPY");
  var X = Roofing(seriesC(),125,20);

  if(is(LOOKBACK)) return;
  plotGraph("Loop",X,Y,DOT|GRAPH,BLUE);
  plotGraph("Loops",X,Y,SPLINE|GRAPH,TRANSP|GREY);
  if(is(EXITRUN))
    plotGraph("Last",X,Y,SQUARE|GRAPH,RED);
}
The resulting chart for the period from August to November 2021:
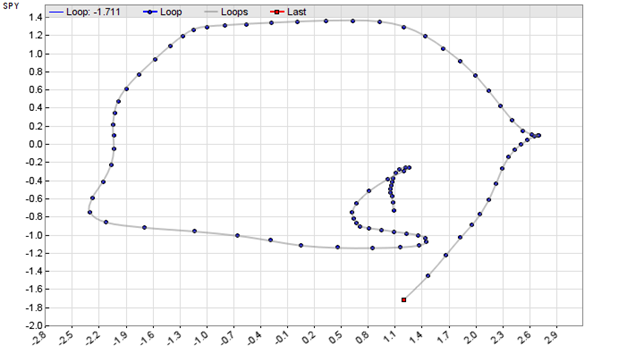
I found that Ehlers’ roofing filter is sensitive to the lookback period. It needs some time to ‘swing in’. A too short lookback period, like Zorro’s default 80 bars, produces a visibly different loop. With 300 bars we’re on the safe side.
What can you now do with this loop chart? Ehlers proposed to switch between stock and index depending on the loop rotation and angle quadrant. Our example above, with the SPY index on the Y axis and the stock on the X axis, has a clockwise rotating loop. On clockwise rotations, buy the stock and sell the index from 5 to 10 on the clock face. Sell the stock and buy the index from 11 to 4. Be out of the market between 4 and 5, and have both positions between 10 and 11.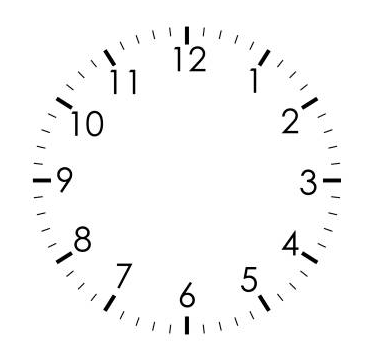
On a counter clockwise rotation, do just the opposite. This was intended for discretionary trading, but can of course be automated with a script. Which I also gracefully leave to the reader.
The Roofing indicator and the Ehlers Loop scripts can be downloaded from the 2022 script repository. The Zorro software can be downloaded from https://zorro-project.com.
I don’t like it. But I’m glad Mr. Ehler is coming up with fresh ideas.
Ehler comes up with all kinds of new filters. The Roofing Band Pass filters do have some predictability – got an AUC of 0.5335 but similar to fast/slow moving averages and disappointing for all the hype and compute/time invovled
FYI _ I am trying to predict N-day return with all these calculated on daily data