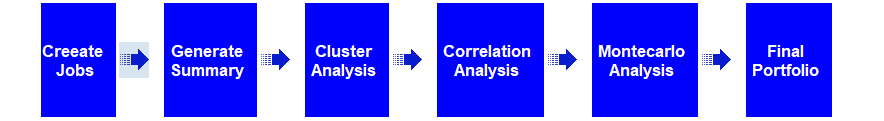
Developing a successful strategy is a process with many steps, described in the Build Better Strategies article series. At some point you have coded a first, raw version of the strategy. At that stage you’re usually experimenting with different functions for market detection or trade signals. The problem: How can you determine which indicator, filter, or machine learning method works best with which markets and which time frames? Manually testing all combinations is very time consuming, close to impossible. Here’s a way to run that process automated with a single mouse click. Continue reading “Build Better Strategies, Part 6: Evaluation”
Tag: Zorro
Pimp your performance with key figures

Not all scripts we’re hired to write are trading strategies. Some are for data analysis or event prediction – for instance: Write me a script that calculates the likeliness of a stock market crash tomorrow. Some time ago a client ordered a script for improving the performance of their company. This remarkable script was very different to a trading system. Its algorithm can in fact improve companies, but also your personal performance. How does this work? Continue reading “Pimp your performance with key figures”
Better Tests with Oversampling

The more data you use for testing or training your strategy, the less bias will affect the test result and the more accurate will be the training. The problem: price data is always in short supply. Even shorter since you must put aside some part for out-of-sample tests. Extending the test or training period far into the past is not always a solution. The markets of the 1990s or 1980s were very different from today, so their price data can cause misleading results.
In this article I’ll describe a simple method to produce more trades for testing and training from the same amount of price data. As a side effect, you’ll get an additional metric for the robustness of your strategy. Continue reading “Better Tests with Oversampling”
The Cold Blood Index
You’ve developed a new trading system. All tests produced impressive results. So you started it live. And are down by $2000 after 2 months. Or you have a strategy that worked for 2 years, but revently went into a seemingly endless drawdown. Situations are all too familiar to any algo trader. What now? Carry on in cold blood, or pull the brakes in panic?
Several reasons can cause a strategy to lose money right from the start. It can be already expired since the market inefficiency disappeared. Or the system is worthless and the test falsified by some bias that survived all reality checks. Or it’s a normal drawdown that you just have to sit out. In this article I propose an algorithm for deciding very early whether or not to abandon a system in such a situation. Continue reading “The Cold Blood Index”
Is “Scalping” Irrational?

Clients often ask for strategies that trade on very short time frames. Some are possibly inspired by “I just made $2000 in 5 minutes” stories on trader forums. Others have heard of High Frequency Trading: the higher the frequency, the better must be the trading! The Zorro developers had been pestered for years until they finally implemented tick histories and millisecond time frames. Totally useless features? Or has short term algo trading indeed some quantifiable advantages? An experiment for looking into that matter produced a surprising result. Continue reading “Is “Scalping” Irrational?”
Hacker’s Tools

For our financial hacking experiments (and for harvesting their financial fruits) we need some software machinery for research, testing, training, and live trading financial algorithms. There are many tools for algo trading, but no existing software platform today is really up to all those tasks. You have to put together your system from different software packages. Fortunately, two are normally sufficient. I’ll use Zorro and R for most articles on this blog, but will also occasionally look into other tools. Continue reading “Hacker’s Tools”
Trend Indicators
The most common trade method is ‘going with the trend‘. While it’s not completely clear how one can go with the trend without knowing it beforehand, most traders believe that ‘trend’ exists and can be exploited. ‘Trend’ is supposed to manifest itself in price curves as a sort of momentum or inertia that continues a price movement once it started. This inertia effect does not appear in random walk curves. Continue reading “Trend Indicators”