You’ve developed a new trading system. All tests produced impressive results. So you started it live. And are down by $2000 after 2 months. Or you have a strategy that worked for 2 years, but revently went into a seemingly endless drawdown. Situations are all too familiar to any algo trader. What now? Carry on in cold blood, or pull the brakes in panic?
Several reasons can cause a strategy to lose money right from the start. It can be already expired since the market inefficiency disappeared. Or the system is worthless and the test falsified by some bias that survived all reality checks. Or it’s a normal drawdown that you just have to sit out. In this article I propose an algorithm for deciding very early whether or not to abandon a system in such a situation.
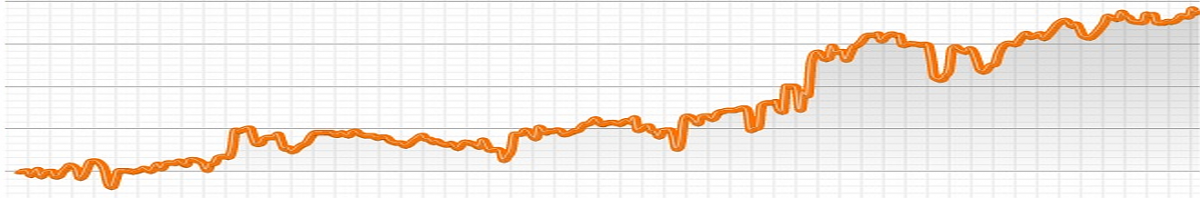
When you start a trading strategy, you’re almost always under water for some time. This is a normal consequence of equity curve volatility. It is the very reason why you need initial capital at all for trading (aside from covering margins and transaction costs). Here you can see the typical bumpy start of a trading system:
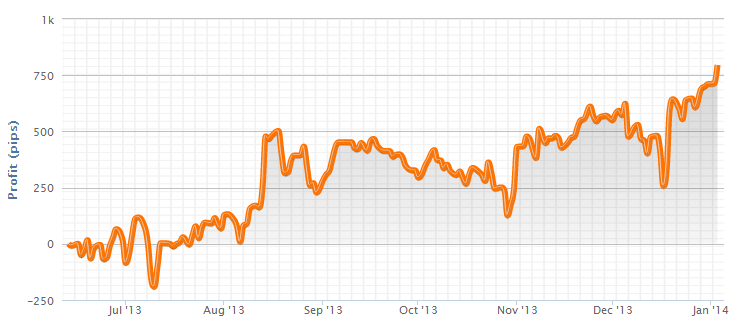
You can estimate from the live equity curve that this system was rather profitable (it was a grid trader exploiting the CHF price cap). It started in July 2013 and had earned about 750 pips in January 2014, 7 months later. Max drawdown was ~400 pips from September until November. So the raw return of that system was about 750/400 ~= 180%. Normally an excellent value for a trade system. But you can also see from the curve that you were down 200 pips about six weeks into trading, and thus had lost almost half of your minimum initial capital. And if you had started the system in September, you had even stayed under water for more than 3 months! This is a psychologically difficult situation. Many traders panic, pull out, and this way lose money even with highly profitable systems. Algo trading unaffected by emotions? Not true.
Not so out of sample
The basic problem: you can never fully trust your test results. No matter how out-of-sample you test it, a strategy still suffers from a certain amount of Data-Snooping Bias. The standard method of measuring bias – White’s Reality Check – works well for simple mechanically generated systems, as in the Trend Experiment. But all human decisions about algorithms, asset selection, filters, training targets, stop/takeprofit mechanisms, WFO windows, money management and so on add new bias, since they are normally affected by testing. The out-of-sample data is then not so out-of-sample anymore. While the bias by training or optimization can be measured and even eliminated with walk forward methods, the bias introduced by the mere development process is unknown. The strategy might still be profitable, or not anymore, or not at all. You can only find out by comparing live results permanently with test results.
You could do that with no risk by trading on a demo account. But if the system is really profitable, demo time is sacrificed profit and thus expensive. Often very expensive, as you must demo trade a long time for some result significancy, and many strategies have a limited lifetime anyway. So you normally demo trade a system only a few weeks for making sure that the script is bug-free, then you go live with real money.
Pull-out conditions
The simplest method of comparing live results is based on the maximum drawdown in the test. This is the pull-out inequality:
[pmath size=18]E ~<~ C + G t/y – D[/pmath]
E = Current account equity
C = Initial account capital
G = Test profit
t = Live trading period
y = Test period
D = Test maximum drawdown
This formula means simply that you should pull out when the live trading drawdown exceeds the maximum drawdown from the test. Traders often check their live results this way, but there are many problems involved with this method:
- The maximum backtest drawdown is more or less random.
- Drawdowns grow with the test period, thus longer test periods produce worse maximum drawdowns and later pull-out signals.
- The drawdown time is not considered.
- The method does not work when profits are reinvested by some money management algorithm.
- The method does not consider the unlikeliness that the maximum drawdown happens already at live trading start.
For those reasons, the above pullout inequality is often modified for taking the drawdown length and growth into account. The maximum drawdown is then assumed to grow with the square root of time, leading to this modified formula:
[pmath size=18]E ~<~ C + G t/y – D sqrt{{t+l}/y}[/pmath]
E = Current account equity
C = Initial account capital
G = Test profit
t = Live trading period
y = Test period
D = Maximum drawdown depth
l = Maximum drawdown length
This was in fact the algorithm that I often suggested to clients for supervising their live results. It puts the drawdown in relation to the test period and also considers the drawdown length, as the probability of being inside the worst drawdown right at live trading start is l/y. Still, the method does not work with a profit reinvesting system. And it is dependent on the rather random test drawdown. You could address the latter issue by taking the drawdown from a Montecarlo shuffled equity curve, but this produces new problems since trading results have often serial correlation.
After this lenghty introduction for motivation, here’s the proposed algorithm that overcomes the mentioned issues.
Keeping cold blood
For finding out if we really must immediately stop a strategy, we calculate the deviation of the current live trading situation from the strategy behavior in the test. For this we do not use the maximum drawdown, but the backtest equity or balance curve:
- Determine a time window of length l (in days) that you want to check. It’s normally the length of the current drawdown; if your system is not in a drawdown, you’re probably in cold blood anyway. Determine the drawdown depth D, i.e. the net loss during that time.
- Place a time window of same size l at the start of the test balance curve.
- Determine the balance difference G from end to start of the window. Increase a counter N when G <= D.
- Move the window forward by 1 day.
- Repeat steps 3 and 4 until the window arrived at the end of the balance curve. Count the steps with a counter M.
Any window movement takes a sample out of the curve. We have N samples that are similar or worse, and M-N samples that are better than the current trading situation. The probability to not encounter such a drawdown in T out of M samples is a simple combinatorial equation:
[pmath size=18]1-P ~=~ {(M-N)!(M-T)! }/ {M!(M-N-T)!}[/pmath]
N = Number of G <= D occurrences
M = Total samples = y-l+1
l = Window length in days
y = Test time in days
T = Samples taken = t-l+1
t = Live trading time in days
P is the cold blood index – the similarity of the live situation with the backtest. As long as P stays above 0.1 or 0.2, probably all is still fine. But if P is very low or zero, either the backtest was strongly biased or the market has significantly changed. The system can still be profitable, just less profitable as in the test. But when the current loss D is large in comparison to the gains so far, we should stop.
Often we want to calculate P soon after the begin of live trading. The window size l is then identical to our trading time t, hence T == 1. This simplifies the equation to:
[pmath size=18]P ~=~ N/M[/pmath]
In such a situation I’d give up and pull out of a painful drawdown as soon as P drops below 5%.
The slight disadvantage of this method is that you must perform a backtest with the same capital allocation, and store its balance or equity curve in a file for later evaluation during live trading. However this should only take a few lines of code in a strategy script.
Here’s a small example script for Zorro that calculates P (in percent) from a stored balance curve when a trading time t and drawdown of length l and depth D is given:
int TradeDays = 40;    // t, Days since live start
int DrawDownDays = 30; // l, Days since you're in drawdown
var DrawDown = 100;    // D, Current drawdown depth in $

string BalanceFile = "Log\\BalanceDaily.dbl"; // stored double array

var logsum(int n)
{
  if(n <= 1) return 0;
  return log(n)+logsum(n-1);
}

void main()
{
  int CurveLength = file_length(BalanceFile)/sizeof(var);
  var *Balances = file_content(BalanceFile);

  int M = CurveLength - DrawDownDays + 1;
  int T = TradeDays - DrawDownDays + 1;

  if(T < 1 || M <= T) {
    printf("Not enough samples!");
    return;
  }

  var GMin=0., N=0.;
  int i=0;
  for(; i < M-1; i++)
  {
    var G = Balances[i+DrawDownDays] - Balances[i];
    if(G <= -DrawDown) N += 1.;
    if(G < GMin) GMin = G;
  }

  var P;
  if(TradeDays > DrawDownDays)
    P = 1. - exp(logsum(M-N)+logsum(M-T)-logsum(M)-logsum(M-N-T));
  else
    P = N/M;

  printf("\nTest period: %i days",CurveLength);
  printf("\nWorst test drawdown: %.f",-GMin);
  printf("\nM: %i N: %i T: %i",M,(int)N,T);
  printf("\nCold Blood Index: %.1f%%",100*P);
}
Since my computer is unfortunately not good enough for calculating the factorials of some thousand samples, I’ve summed up the logarithms instead – therefore the strange logsum function in the script.
Conclusion
- Finding out early whether a live trading drawdown is ‘normal’ or not can be essential for your wallet.
- The backtest drawdown is a late and inaccurate criteria.
- The Cold Blood Index calculates the precise probability of such a drawdown based on the backtest balance curve.
I’ve added the script above to the 2015 scripts collection. I also have suggested to the Zorro developers to implement this method for automatically analyzing drawdowns while live trading, and issue warnings when P gets dangerously low. This can also be done separately for components in a portfolio system. This feature will probably appear in a future Zorro version.
You articles are fantastic! Thank you very much!
cool post! but it would be remiss if this article didn’t have at least one rick james reference https://www.youtube.com/watch?v=Vm4jJQFXWp4
It just happened to me. My algo back tested great. It paper traded great. Live trading was 2 loss days in a row. I pulled out to evaluate. I run the back test against the two live days and get 2 win days. WTF! I am about to go through the trades comparing back test for the two days to the live trades for the two days. Ugh! But I need to know why the difference occurred.
I will then implement the algorithm you suggest here. I use QuantConnect, but it should be easy enough to translate Zorro to C#. Thanks very much.
Hi Nicholas, the algorithm would probably not be first priority in this case. If you backtested the same 2 days and get a win instead of a loss, something is seriously wrong. Comparing the same day in backtest and live trading must produce the same result, aside from small differences. Otherwise it’s either a serious flaw in the QuantConnect trade simulator, or different historical data, or some randomness in your system. Or the broker played a trick on you. You should find out, else you can not trust your backtests at all.
MT4 servers have a hidden feature named “Virtual Dealer Plugin” for artificial slippage and other evil things. If your broker activated that feature, live trading can be very different to the backtest.
Great post and thank you for sharing. I was looking for a solution like this recently in order to objectively decide when to pull out of a strategy. I settled on a modification of your second example, where an allowance is made for the drawdown to grow with time. The modification I made was to use the confidence intervals for the maximum drawdown calculated by Zorro’s Monte Carlo engine rather than the maximum drawdown of the backtest. The limitation is that we don’t know the confidence intervals for the maximum drawdown length – only the maximum drawdown depth. I used the maximum drawdown length calculated for the backtest and considered where the backtest drawdown depth lay in relation to the confidence intervals calculated via Monte Carlo to get a feel for whether it was a reasonable value.
I like your Cold Blood Index a lot. It is more meaningful than the approach I used, but it does suffer from a similar drawback – that is, being a function of the balance curve in the backtest. If you accept that the balance curve obtained in the backtest is one possible outcome amongst an infinite number of possibilities due to the random nature of individual trade results, then the result obtained with the Cold Blood Index is likewise one possible outcome amongst many.
(As an aside, this condition can be validated by examining the autocorrelation of the backtest returns series with various lags using either Zorro, R or some other statistical tool. Nearly every strategy I’ve experimented with, and definitely the few that I’ve taken live, have all shown statistically insignificant return autocorrelations).
I think your (fantastic) idea of the Cold Blood Index could be improved by incorporating the algorithm into a Monte Carlo routine that creates many unique balance curves by randomly sampling the backtested trade results, and running it separately on each curve. Obviously the computation time would become significant, so the additional effort would only be worth it having confirmed that the returns series exhibits statistically insignificant autocorrelation.
Is this something that would be possible with Zorro, or do you think it would be a more efficient use of time to attempt it directly within R?
Thanks for sharing your research. I learn a lot from every post.
This is a good idea. You need no R, just a few additional lines in the Zorro code. Shuffle the balance curve with the randomize() function, then calculate P. Do that in a loop and collect an array of P values. You can then get the confidence interval with the percentile() function at 5% and 95%.
The randomize() function is the Zorro equivalent of the R sample() function, and percentile() is the equivalent of quantile(). But you’ll need the Zorro beta for this – randomize was implemented recently and I believe it’s not yet in the release version.
Thanks! I have Zorro Beta so will have a go at implementing this.
Impresive work as allways jcl!
Speaking about the differences between live trading and backtest. I guess one of the common ones could be the broker spread and other similar factors. In that case the DD could change depending on the broker so the strategy can still be profitable even though the Cold Blood Index tell us that it is not. The thing is that if we would use the new live data in the backtest and if we’d use the same parameteres from the broker, probably the DD would be different. My point is, if it would make sense to create a kind of montecarlo analysis were the historical data is moved slightly and the same with the spread. Then we could find the range in which the strategy is still profitable and we could predict the behaviour of the strategy due to the spread change and due to a different historical data. Does it make sense?
You must anyway test a system with the actual spreads, margins, and fees of your broker before trading it live. A “general test” with no broker parameters can be very misleading. For instance, the same strategy that returns annually 100% in a backtest with an FXCM account would return only 10% with an IB account. And IB has higher margins and lot sizes, thus a system might trade less often when you test it with the same capital. So the backtest balance curve must be produced with the very account and asset parameters that you also get in live trading.
It’s different with historical price data – that needs not be from the same broker, unless you trade on very short time frames. The prices can still be slightly different, but a good backtest platform has methods such as oversampling for taking care of that.
Thank you for the article.
I think the window size should be DrawdownDays + 1 as we need two data point to get a drawdown.
The for loop should be i < M to loop though all the samples.
Please correct me if I am wrong.
You’re right, the window size must indeed be one higher than Drawdowndays, but the data points must not, as every data point G is the difference of two balance values:
var G = Balances[i+DrawDownDays] – Balances[i];
So if DrawDownDays == 1, you get the difference of Balances[i+1] and Balances[i].
Because you must access Balances[i+1] and M == CurveLength, the loop must only run M-1 times, otherwise you would access one balance value past the end of the array.
Thanks for the aclaration.
I see from the comments that it is relevant to check the strategy against the demo/live trades. And for that it is useful to make a backtest in the same period as the strategy is in demo/live.
I wonder if it make then sense to add a “retest” option in the script so if the test buttom is clicked in trade mode, a test of the demo/live period is executed and the result is compared to the result of the demo/live trades in the same period.
In this way after two weeks in trade mode, one can find bugs in the script or improvements and since two weeks maybe not enough time to get enough data for the cold blood index analysis, then it could be helpful.
Yes, this is in fact highly recommended during the period when you demo trade a new system. Running the same script in a backtest with the same price data must produce a similar result, aside from small differences due to slippage or changes in spread and rollover. If the result is very different, something is wrong with the script, or maybe even with the platform or the broker’s price data stream.
Would then make sense to implement a “retest” function in Zorro as there is the “retrain” function?
I used a small script for that, but a dedicated button would be certainly easier for users. I’ll forward your suggestion to the Zorro developers.
Glad to know I can add some value to the project.
I was thinking that as the “retrain” works while trading by clicking the trade button. The “retest” could be the same by clicking the test buttom. A balance curve of both the test and the demo/live trades could be plotted in the same graph
Please, could you explain why we compare the draw down value D with the strategy gain G? Do we suggest that since the strategy is able to give us a positive result of the size G then it also may potentially bring us a negative result of about the same size G? Isn’t it strange? Or is there some maths behind it?
Yes, the math is that both D and G are proportional to the traded volume, i.e. trade size and frequency. So D is always a percentage of G. This percentage is a performance measure, and its reciprocal is equivalent to the Calmar ratio.
Does this statement require any conditions on the process of trade results? Eg. that they are mutually independent and equally distributed or even belong to some exact class (symmetric, gaussian)?
Indirectly yes. The maximum drawdown is not only proportional to the annual gain, it is also proportional to the square root of time. Therefore you normally use a 3-years adjusted drawdown value. However this makes some assumptions. The square root adjustment is accurate only for a system with independent trade results and zero profit. Systems with a positive or negative profit expectancy have a slightly different and more complex drawdown growth formula. But the square root of time is always a good approximation.
Amazing article, Thanks for sharing all these! 😀