
“Sell in May and go away” is an old stock trader’s wisdom. But in his TASC May 2022 article, Markos Katsanos examined that rule in detail and found that it should rather be “Sell in August and buy back in October”. Can trading be really this easy? Let’s have a look at the simple seasonal trading rule and a far more complex application of it.
The trading algorithm “Sell in August and buy back in October” could have been realized with the Zorro software in just 5 lines of C:
asset("SPY");
if(month() == 8 && tdm() == 1) // sell 1st trading day of August
  exitLong();
else if(month() == 10 && tdm() == 1) // buy back 1st trading day of October
  enterLong();
Alas, this seasonality trading system was apparently way too simplistic for Markos Katsanos. His version is a veritable monster with many, many trade entry and exit conditions. The trading script below is a 1:1 translation from his AmiBroker code to C for the Zorro platform. I only moved his VFI indicator – a variant of the On Balance Volume, but with a lot more signals – in a separate indicator function because I didn’t like trading logic cluttered with indicator code.
var priceAvg(int Offset) {
  return (priceC(Offset)+priceH(Offset)+priceL(Offset))/3;
}

var VFI(var Period,var Coef, var VCoef)
{
  vars Inters = series(log(priceAvg(0))-log(priceAvg(1)));
  var Vinter = StdDev(Inters,30);
  var Cutoff = Coef * Vinter * priceC();
  vars Volumes = series(marketVol());
  var Vave = SMA(Volumes+1,Period);
  var Vmax = Vave * VCoef;
  var VC = min(Volumes[0],Vmax);
  var MF = priceAvg(0)-priceAvg(1);
  vars VCPs = series(ifelse(MF > Cutoff,VC,ifelse(MF < -Cutoff,-VC,0)));
  var VFI1 = Sum(VCPs,Period)/Vave;
  return EMA(VFI1,3);
}

function run()
{
  StartDate = 2006;
  EndDate = 2022;
  BarPeriod = 1440; // 1 day
  LookBack = 150;

  assetList("AssetsIB");
  MaxLong = 1;
  Capital = 100000;
  Margin = Equity; // invest all you have
  Leverage = 1;
  BarZone = EST;
  Fill = 3; // enter/exit at next day open
  set(PARAMETERS,TESTNOW,PLOTNOW);

  asset("VIX");
  var VIXdn = (priceC(0)/HH(25,0)-1)*100;
  var VIXup = (priceC(0)/LL(25,0)-1)*100;

  asset("SPY");
  int SellMonth = optimize(8,5,8,1);
  var VIXupMax = optimize(60,50,60,10);
  var Crit = -optimize(20,15,20,5); //VFI SELL
  var K = optimize(1.5,1.3,1.7,.2); // ATR/VIX RATIO
  vars ATRs = series(ATR(15));
  var ATRDn = (ATRs[0]/MaxVal(ATRs,25)-1)*100;
  var ATRUp = (ATRs[0]/MinVal(ATRs,25)-1)*100;
  vars VFIs = series(VFI(130,0.2,2.5));
  vars SMAVFIs = series(SMA(VFIs,10));
  bool VolCondition = (VIXup < VIXupMax || ATRUp < K*VIXupMax ) && VFIs[0] > Crit;
  bool Buy = (month() >= 10 || month() < SellMonth) && ref(VolCondition,1) != 0;
  bool SellSeasonal = month() == SellMonth ; //SEASONAL
  bool SellVolatility = VIXup > 2*VIXupMax ; //VOLATILITY EXIT
  bool SellMF = crossUnder(VFIs,Crit) && SMAVFIs[0] < SMAVFIs[1] ;
  bool Sell = SellSeasonal || ref(SellVolatility,1) != 0 || ref(SellMF,1) != 0;

  if(Sell)
    exitLong();
  else if(Buy)
    enterLong();
}
Phew. And who said that you need at least 30 historical trades per optimized parameter? We’re optimizing the heck out of sell month, threshold, ratio, and other parameters, and won’t care that this strategy trades only once per year. All is in-sample of course, since the low number of trades prevents walk-forward optimization. As can be expected, our reward is a splendid backtest:
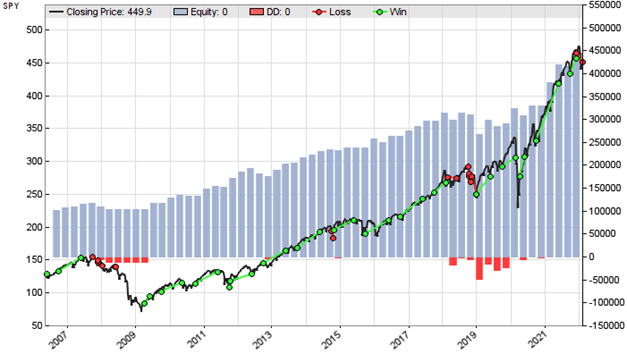
We can see that the system managed to avoid the 2008 market drop, since it doubtlessly knew it in advance due to the in-sample optimization. So take the result with a grain – or better, a bag – of salt. For the audacious experimenter, the VFI indicator and the seasonality trading system can be downloaded from the 2022 script repository. You need Zorro S 2.47 or above for supporting volume and for the ref macro. And since the question recently came up: you can find the script repositories under “Links & Download” on the right side of this page.
One thought on “Never Sell in May!”