
I was recently hired to code a series of indicators based on monthly articles in the Stocks & Commodities magazine, and to write here about the details of indicator programming. Looking through the magazine, I found many articles useful, some a bit weird, some a bit on the esoteric side. So I hope I won’t have to code Elliott waves or harmonic figures one day. But this first one is a very rational indicator invented by a famous algo trader.
You know the problem with indicators: the more accurate they are, the more they trail behind the price. In his books and seminars, John Ehlers has repeatedly tackled this problem, and proposed many indicators with little, if not zero, lag. His new indicators from the article “Reflex: A New Zero-Lag Indicator” in Stocks & Commodities 2/2020 are supposed to remove trend from the price curve with almost no lag. They come in two flavours, ReFlex and TrendFlex.
The algorithm of the ReFlex indicator:
- Smooth the price curve with a lowpass filter.
- Draw a line from the price N bars back to the current price.
- Take the average vertical distance from line to price.
- Divide the result by its standard deviation.
The algorithm of the TrendFlex indicator:
- Smooth the price curve with a lowpass filter.
- Take the average difference of the last N prices to the current price.
- Divide the result by its standard deviation.
So the indicators are a filtered and normalized moving average, but of price differences. Ehlers provided TradeStation code that is very similar to Zorro’s lite-C, so coding the indicators was a matter of minutes. Here are the C versions:
var ReFlex(vars Data,int Period)
{
	var a1,b1,c1,c2,c3,Slope,DSum;
	vars Filt = series(Data[0]), MS = series(0);
	int i;

//Gently smooth the data in a SuperSmoother
	a1 = exp(-1.414*2*PI/Period);
	b1 = 2*a1*cos(1.414*PI/Period);
	c2 = b1;
	c3 = -a1*a1;
	c1 = 1-c2-c3;
	Filt[0] = c1*(Data[0]+Data[1])/2 + c2*Filt[1] + c3*Filt[2];

//Period is assumed cycle period
	Slope = (Filt[Period]-Filt[0]) / Period;

//Sum the differences
	for(i=1,DSum=0; i<=Period; i++)
		DSum += (Filt[0] + i*Slope) - Filt[i];
	DSum /= Period;

//Normalize in terms of Standard Deviations
	MS[0] = .04*DSum*DSum + .96*MS[1];
	if(MS[0] > 0.) return DSum/sqrt(MS[0]);
	else return 0.;
}
var TrendFlex(vars Data,int Period)
{
	var a1,b1,c1,c2,c3,Slope,DSum;
	vars Filt = series(Data[0]), MS = series(0);
	int i;

//Gently smooth the data in a SuperSmoother
	a1 = exp(-1.414*2*PI/Period);
	b1 = 2*a1*cos(1.414*PI/Period);
	c2 = b1;
	c3 = -a1*a1;
	c1 = 1-c2-c3;
	Filt[0] = c1*(Data[0]+Data[1])/2 + c2*Filt[1] + c3*Filt[2];

//Sum the differences
	for(i=1,DSum=0; i<=Period; i++)
		DSum += Filt[0] - Filt[i];
	DSum /= Period;

//Normalize in terms of Standard Deviations
	MS[0] = .04*DSum*DSum + .96*MS[1];
	if(MS[0] > 0.) return DSum/sqrt(MS[0]);
	else return 0.;
}
Data is the price curve and Period is the N from the above algorithm description. If you are familiar with C programming, the only unusual line that you encounter is this one:
vars Filt = series(Data[0]), MS = series(0);
This line allocates time series to the variables Filt and MS. So far so good. But if you allocate a time series for an indicator, it is very important to fill it with the correct initial value. Here it is Data[0], the most recent price, for the Filt series. What happened if we filled it with 0 instead? Filt is the lowpass filtered price, from Ehlers’ “SuperSmoother” algorithm. If a lowpass filter starts with 0, it will creep veeerrry slooowly from 0 up to the filtered price. This would make the initial values of that filter useless. So this is my first important tip for indicator programming, initialize a time series always with a value in the range that it is supposed to generate.
Why are we using global time series at all? We could have defined static arrays instead. And I can see that some of my colleagues who coded the same indicators for other platforms did that. And that would be ok when the platform only supported strategies with a single asset and a single time frame. But when the indicators are called with different time frames and different price curves in the same strategy, static arrays get all mixed up and the indicators produce wrong values. If in doubt, use series. That was my second tip.
A small C script for plotting the indicators for the 2019 SPY curve:
function run()
{
   BarPeriod = 1440;
   StartDate = 20181220;
   EndDate = 20191231;
   asset("SPY");
   vars Prices = series(priceClose());
   plot("ReFlex",ReFlex(Prices,20),NEW|LINE,RED);
   plot("TrendFlex",TrendFlex(Prices,20),LINE,BLUE);
}
The result:
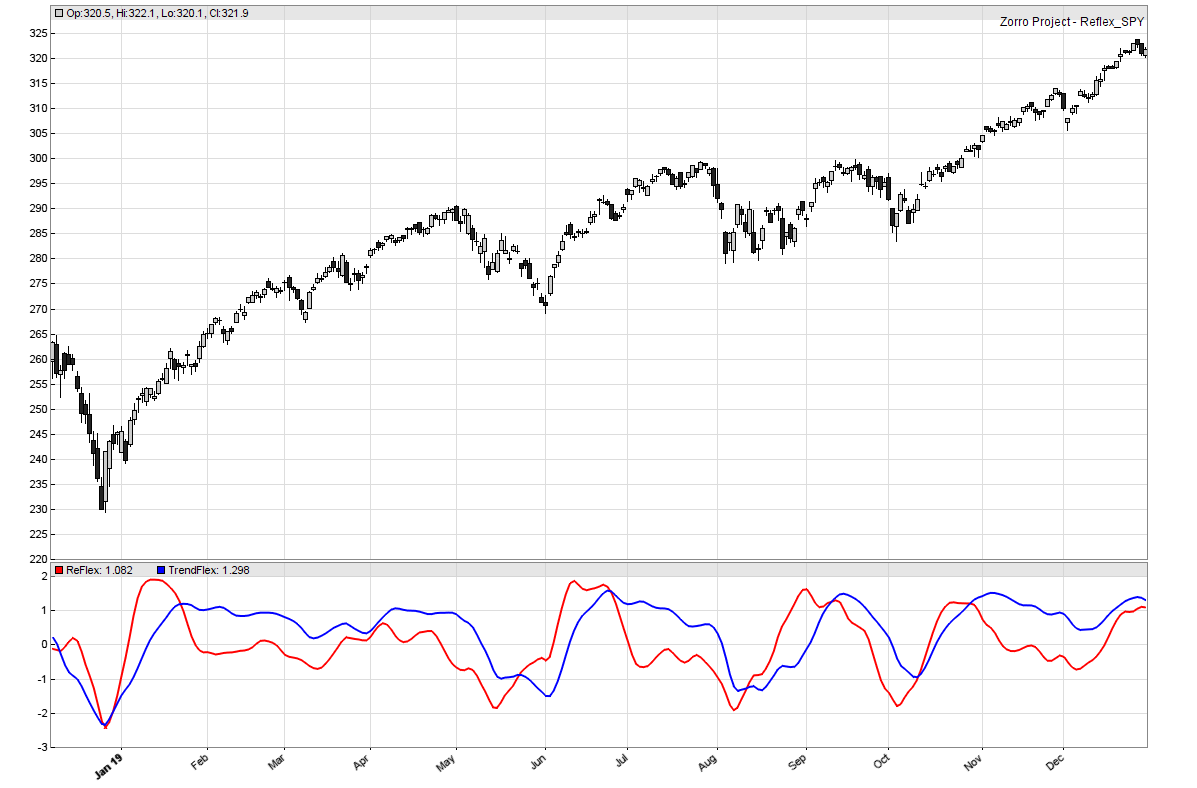
You can see that the indicators have indeed almost no lag. Remains the question how and for what you can use them. In the article, Ehlers is quite silent about the purpose of his indicators. So my first idea is using them for trade signals. Since they follow the peaks and valley of the price curve with no lag, my idea was entering a long position at a valley, and reversing to short at a peak. So I added these lines to the plotting script:
vars Signals = series(ReFlex(Prices,20));
if(valley(Signals)) enterLong();
if(peak(Signals)) enterShort();
But alas, the result is no good. And it does not get much better when I used variants for generating the trade signals, like crossovers or zones, and increase the test period. Sure enough, some variants generate positive results, but they would not pass a reality check.
However, the indicators are in the +/-2 range and have really almost no lag. This makes them a good choice as trendless inputs to a machine learning system, such as a deep learning ANN. Maybe someone finds another good use for them!
The indicators in the C language for the Zorro platform are available in the scripts 2020 archive. They can be added to any trading system with an #include statement.
Reference: John Ehlers, Reflex: A New Zero-Lag Indicator, Stocks&Commodities 02/2020
Hello Petra,
Is there any info or reference(what alogirthm) how “Ascent optimization” mode of optimize function works ? Or could you point me out how to find “plateau”/most stable parameters ?
I often use Ascent optimization but do not know the tiny details. As far as I know Ascent generates splines through the parameter space and then walks along these splines for finding the peaks that are both wide and high.
Looks like Reflex could be interpreted as “big players” and trendflex retail traders.
Reflex cross below mid line, trendflex crossing down, or changing slope into direction down, sell.
Emergency exit, once Reflex changes back up, trendflex failed to follow and Reflex crossing up the trendflex.
Same but inverse, for buy.
Another option, calculate the difference, like macd, apply (sorry I am not mathematician, Fisher Transform / inverse Fisher Transform) and use the diff oscillator of both for signals.
This is awesome.
Thank you for the porting to Zorro.
You will find that normal indicator use, how you did put as samples in your code doesn’t return awesome results.
However, those indicators definitly are all needed for a really awesome system.
Problem, my programming skills are not yet good enough.
I try, and you should too, to align the Trendcomponent according to the cycle component.
Therefore I try to create a function that simulates trading, to let Zorro determine the cycle length.
function traincycles()
{
vars Prices = series(priceClose());
int Cycle = optimize(10, 1, 55, 1);
int CycleFast = optimize(10, 1, Cycle, 1);
int TrendCycle = (Cycle+CycleFast)/2;
plot(“ReFlex”,ReFlex(Prices,Cycle),NEW|LINE,RED);
plot(“ReFlexFast”,ReFlex(Prices,CycleFast),LINE,GREEN);
plot(“TrendFlex”,TrendFlex(Prices,TrendCycle),LINE,GREEN);
vars Signals = series(ReFlex(Prices,Cycle));
vars SignalsFast = series(ReFlex(Prices,CycleFast));
//Good Cycle Train Algo II
if(SignalsFast[0] > 0 && Signals[0] > 0) enterShort();
if(SignalsFast[0] < 0 && Signals[0] < 0) enterLong();
return TrendCycle;
}
I want to return it and store it, then in the next step, for a trend trading system, the peak and valley functions are used on the TrendFlex with the returned values of the above "train only" function.
I am still struggeling….
A note on the signals and systems aspect of this indicator’s algorithm. Low Pass Filters (LPFs) all have delay. There are two common ways to mitigate it.
1) Weight the latest data heaviest or reduce the number of taps of memory used in the FIR or IIR filter.
2) Oversample the data so that the effects of the taps on delay are reduced.
It may be worth trying a reduced LPF or remove it entirely. Oversampling would likely be useful if one insisted on using the LPF.
Cheers.
Hi.
You have code from Larry Wiliams.
Regards.
I am very new to Zorro. How do I test this?
Do I add ReFlex and TrendFlex functions in “Source\indicators.c” file?
No, you add them to the script where you want to use them. And don’t copy them from this website, copy them out of the Zerolag script from the 2020 scripts collection.
I am very glad that you are providing a fresh look at the TAS&C indicators. I subscribed way back in 1982 and I have seen the articles evolve from anecdotal based (which reflected most of the technical analysis books of the time) to the scientific rigor now expected for indicators and trading systems. Most of the time these articles are like viewing part of the Elephant’s trunk not the whole picture. I hope through your contribution these articles will become more useful for traders recognizing that everyone has to do their own due diligence to develop the tools best suited for the user.