
Fortunately I could write this article without putting my witch hat on. Despite its name, the ‘Gann Hi-Lo Activator’ was not invented by the famous esotericist, but by Robert Krausz in a 1998 article in the Stocks&Commodities magazine. In a recent article, Barbara Star combined it with other indicators for a swing trading system. Will an indicator with the name ‘Gann’ work outside the realm of the supernatural?
‘Activator’ is an indicator synonym that I didn’t know before. However the Gann Hi-Lo Activator (GHLA) does not activate something, but compares the current price with the SMAs of the highs and lows of a price series. Depending on the comparison, it returns one of the two SMAs. It is said to indicate a bullish market when the current price is above the Activator, and a bearish market when it is below. The comparison sign is also stored in a ‘Color’ variable which we must later use for the swing trading system. The C code:
var ColorGHLA;
var GHLA(int HPeriod,int LPeriod)
{
 vars H = series(priceHigh());
 vars L = series(priceLow());
 vars MaH = series(SMA(H,HPeriod),2);
 vars MaL = series(SMA(L,LPeriod),2);
 vars State = series(0,2);
 if(priceClose() > MaH[1]) State[0] = 1;
 else if(priceClose() < MaL[1]) State[0] = -1;
 else State[0] = State[1]; // return the previous state
 ColorGHLA = State[0];
 return ifelse(State[0] < 0,MaH[0],MaL[0]);
}
We store the sign in the series State of length 2 because the indicator inventor required to return the previous sign when the price was between the two SMAs. If you wonder why I did not just use a static variable to store the previous sign: That would work for one asset, but not for a portfolio, if someone ever wants to trade one with this indicator.
Two other indicators are used in the author’s swing trading system: the difference of Welles Wilder’s plus and minus directional indicators, named DMI, and a variant by William Blau of the Stochastic indicator, named ‘Stochastic Momentum Index’ (SMI). The code:
var DMI(int Period)
{
 return PlusDI(Period) - MinusDI(Period);
}

var SMI(int DLength,int KLength)
{
 var Hi = HH(KLength), Lo = LL(KLength);
 var Diff = Hi-Lo;
 var RelDiff = priceClose()-(Hi+Lo)/2;
 var AvgRel = EMA(EMA(RelDiff,DLength),DLength);
 var AvgDiff = EMA(EMA(Diff,DLength),DLength);
 return ifelse(AvgDiff!=0,AvgRel/AvgDiff*200,0);
}
All 3 together on a chart gives already an impressive show of colorful lines. Here’s the script for replicating the author’s chart with the indicators on an NVDA price curve:
function run()
{
 BarPeriod = 1440;
 StartDate = 20200201;
 EndDate = 20200410;
 assetAdd("NVDA","STOOQ:NVDA.US");
 asset("NVDA");

 var Ghla = GHLA(3,3);
 var Smi = SMI(3,8);
 var Dmi = DMI(10);
 plot("GHLA",Ghla,LINE,BLUE);
 plot("DMI",Dmi,NEW|BARS,BLUE);
 plot("SMI",Smi,NEW|LINE,BLUE);
 plot("Zero",0,0,BLACK);
}
The resulting chart (sorry, blue colors only):
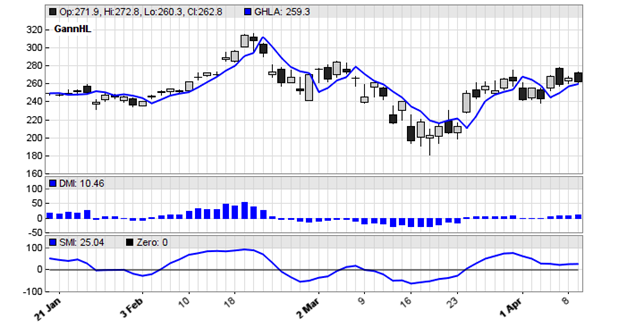
For trading this indicator soup, the author recommends opening a position when all 3 indicators are in sync, meaning they have the same sign. That’s why we needed the ‘color’ of the GHLA. So we will now open a long position when all signs are positive, and reverse to a short one when they are all negative. We can just use the charting script with this additional code:
MaxLong = MaxShort = 1;
if(ColorGHLA > 0 && Dmi > 0 && Smi > 0)
 enterLong();
if(ColorGHLA < 0 && Dmi < 0 && Smi < 0)
 enterShort();
Sure enough, this system shows stellar performance in the author’s example chart of Spring 2020. 3 out of 4 trades are winners. But what happens when we trade it for a longer period, for example 5 years? Set the StartDate variable to a 2015 date and repeat the test.
The sad result:
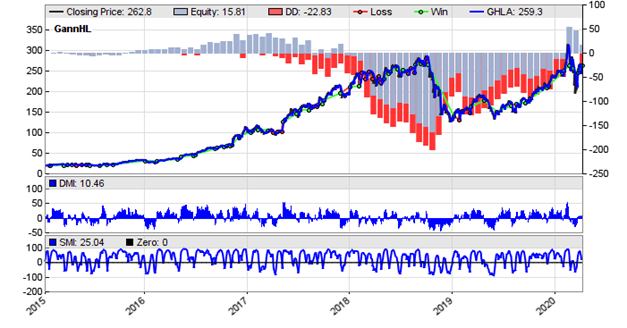
We can see that the system can do anything: win, lose, and stay flat over long periods. The end result is zero. Apparently, successful swing trading needs other methods. Or maybe better indicators? Of course, this quick test does not mean much. It’s possible that the GHLA works when removing the other indicators and using other entry conditions, such as entering positions only on a peak. Or maybe the indicator periods were ill chosen and had to be adapted to the market by an optimization process. But at least we got now three more indicators for our collection.
The SMI, DMI, and GHLA indicators, as well as the code for the chart and the trading system can be downloaded from the 2020 script repository.
Great Article, remind me about Mr. Robert Krausz. Worked with him personally with meetings in the USA and London. He died 2002. Great missing. Got most of his work which is still VERY valid.
One small suggestion, always state the Zorro Version used to give people a hint why in some cases code may not work for them.
Yep. It’s 2.32, but should also work with 2.30, I did not use any new feature.
Would you mind repeating your test using the MMI as the only filter? I’m a big fan of this site, but not a programmer
thanks
Learn programming! Then do any test you want. Unlike C++, C is a simple language that anyone can learn in a couple days.
I coded this in PINE Version 5 (TRADINGVIEW.COM)
H_period=input.int(9)
L_period=input.int(9)
GHLA(HPeriod, LPeriod) =>
var int State = 0
var float result = 0
MaH = ta.sma(high,HPeriod)
MaL = ta.sma(low,LPeriod)
if close > MaH[1]
State := 1
else
if close < MaL[1]
State := -1
else
State := State[1] // return the previous state
result := switch
close
MaL[0]
close > MaH[1] =>
MaH[0]
=>
result[1]
[result, State]
Just in case someone need it.