
In the S&C September 2020 article “Tracking Relative Strength In Four Dimensions”, James Garofallou presents a metric for evaluating a security’s strength relative to 11 major market sectors and over several time periods. All this information is squeezed into a single value. Maybe at cost of losing other important information? In this article we’ll look into how to program such a beast, and how it fares when we use it for rebalancing a stock portfolio.
For getting the 4-dimensional relative strength we start with two dimensions. The RS2 indicator divides a securities’ price by a market index, then calculates four moving averages of the result and encodes their relations in a number that is then returned. Here’s the RS2 code:
var RS2(var Close, string Index)
{
   assetAdd(strf("IDX%i",NumIndex),strf("YAHOO:%s",Index));
   if(!asset(Asset)) return quit("Index not found!");
   var RS2 = Close/priceClose(0);
   var Fast = EMA(series(RS2),10*PERIOD);
   var Med = SMA(series(Fast),7*PERIOD);
   var Slow = SMA(series(Fast),15*PERIOD);
   var VSlow = SMA(series(Slow),30*PERIOD);
   if(Fast >= Med && Med >= Slow && Slow >= VSlow)
      return 10;
   else if(Fast >= Med && Med >= Slow && Slow < VSlow)
      return 9;
   else if(Fast < Med && Med >= Slow && Slow >= VSlow)
      return 9;
   else if(Fast < Med && Med >= Slow && Slow < VSlow)
      return 5;
   else
      return 0;
}
The code above takes the Close of the security and the name of the index for the division. It gets the index price from Yahoo, then determines 4 moving averages as prescribed by the author, and returns either 10, 9, 5, or 0 depending on how fast the price quotient is rising. Note that I had to multiply all MA periods with a predefined PERIOD factor. That’s because I could at first not reproduce the author’s charts, until I found out that his MA periods are apparently not days, but candle width units of his chart. He used 3-day candles for some reason. So I had to multiply all MA periods with a PERIOD of 3. Without this correction, the resulting charts would be very different.
The next step is the RS4, which combines the RS2 values of 11 major market indexes. I used the same Fidelity indexes as the author. The C code of the RS4 indicator:
var RS4(var Close)
{
  var RS3 = RS2(Close,"FXAIX") // SPX 500
    + RS2(Close,"FNCMX") // Nasdaq
    + RS2(Close,"FSMDX") // Mid Cap
    + RS2(Close,"FSSNX") // Small Cap
    + RS2(Close,"FSPGX") // Large Growth
    + RS2(Close,"FLCOX") // Large Val
    + RS2(Close,"FPADX") // Emerging Market
    + RS2(Close,"FSRNX") // Real Estate
    + RS2(Close,"FSAGX") // Gold
    + RS2(Close,"FSUTX") // Utilities
    + RS2(Close,"FTBFX"); // Total Bond
  return 10*RS3/11;
}
The returned value is multiplied with 10 and normalized by the number of indexes. Now we got all 4 dimensions together, the 4th one apparently being the normalization. We can now reproduce the author’s chart with a smoothed RS4 – named “RS4osc” – and a further smoothed signal line. For the security we’re using Fidelity Gold, FSAGX. The code:
voidrun()
{
  BarPeriod = 1440;
  StartDate = 20181201;
  EndDate = 20200415;
  LookBack = 200;
  assetAdd("Gold","YAHOO:FSAGX");
  asset("Gold");
  var RS4Osc = SMA(series(RS4(priceClose(0))),3*PERIOD);
  var Mv = SMA(series(RS4Osc),5*PERIOD);
  plot("RS4Osc",RS4Osc,NEW|LINE,BLUE);
  plot("Mv",Mv,LINE,RED);
}
The resulting chart:
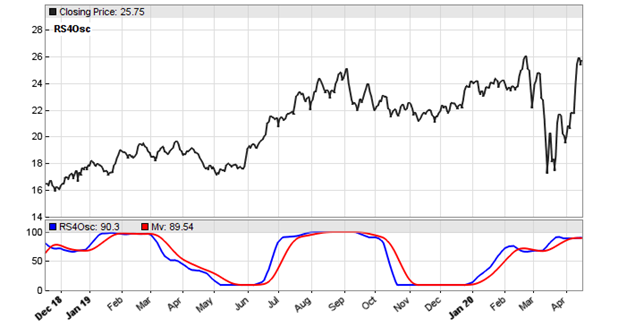
Before you even try: No, the red and blue line crossings in the chart do not indicate profitable trade entries. Not even the author claims that. So what do we do with this indicator? Since it represents strength, let’s try it in a basic portfolio rotation system. Of a universe of 10 major stocks, it shall select the 4 strongest stocks and invest in them according to their strength. The portfolio is rebalanced at any month. First, we use a simple momentum based strength. The code:
void run()
{
  BarPeriod = 1440;
  LookBack = 200;
  StartDate = 2012;
  EndDate = 2020;
  Capital = 10000;
  var Weights[10],Strengths[10];
  string Stock,Stocks[10];
  assetList("assetsIB");
  while(Stock = loop("AAPL","MSFT","XOM","AMZN","JNJ","FB","GE","TSLA","JPM","PG"))
  {
    if(Init) assetHistory(Stock,FROM_STOOQ);
    asset(Stock);
    Stocks[Itor1] = Stock;
    Strengths[Itor1] = RET(30*PERIOD);
  }
  if(month(0) != month(1)) // at any month
  {
    distribute(Weights,Strengths,10,4,0);
    int i;
    for(i = 0; i<10; i++) {
      asset(Stocks[i]);
      int NewShares = Weights[i]*Balance/priceClose(0) - LotsPool;
      if(NewShares > 0)
        enterLong(NewShares);
      else if(NewShares < 0)
        exitLong("",-NewShares);
    }
  }
}
I’ve used the 10 top stocks from the S&P 500. The strength is simply defined as the stock return over 30*3 days, which is the same as the “very long” MA period of the RS2. The distribute function in the code is a special Zorro function that sorts the stocks according to their strength, and assigns weights among the 4 strongest stocks. The remaining 6 weaker stocks get weight 0. The weights are then converted to positions and rebalanced at the first workday of any month by buying or selling stocks.
The resulting equity curve (mind the Covid-19 drop):
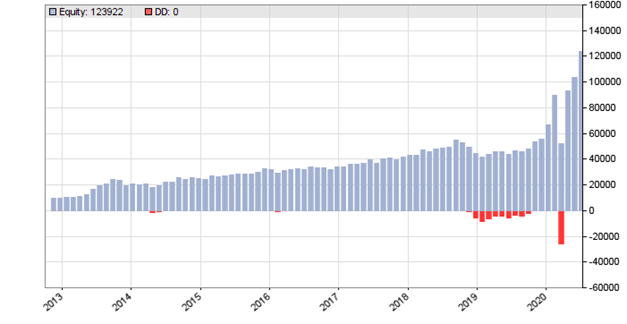
In the backtest from 2012-2020, this system achieves 47% CAGR, mostly due to the strong volatility at the end. It’s not an optimal system and you would probably not want to trade it live. Now what happens when we replace the 90-day return with the RS4? For this we only need to change the line where the strength is calculated:
Strengths[Itor1] = RS4(priceClose(0));
The equity curve of the RS4-based portfolio rotation system:

The CAGR has dropped to 35%. The Covid-19 drop is not as significant, but the the recovery afterwards isn’t either. Although the equity curve looks less volatile, the Sharpe Ratio is in fact lower, 1.01 compared to 1.11 with the previous return-based system.
Does this mean that the RS4 is inferior to a simple 90-day return? No, because I just tried it with the first and simplest stock rotation system that came in mind. For really judging the RS4, a lot more tests with a lot more systems and with walk forward analysis had to be done.
The RS2 and RS4 indicators, as well as the code for the portfolio rotation system can be downloaded from the 2020 script repository.
One thought on “Petra on Programming: Four Dimensions of Strength”