
In his article in the S&C April 2020 issue, Vitali Apirine proposed a modified On Balance Volume indicator (OBVM). The hope was that OBVM crossovers and divergences make great trade signals, especially for stock indices. I got the job to put that to the test.
The original OBV indicator was invented by Joseph Granville in 1963. It differs from other indicators insofar as it takes trade volume into account. The purpose was to measure the volume ‘flowing into and out’ (whatever that means) of an asset. Volume supposedly flows out when the price goes down, and flows in when it goes up. The net sum of all the flowing is the OBV. This is its algorithm in C for the Zorro platform:
var OBV(vars Data,var Volume)
{
  vars OBVData = series(Volume,2);
  if(Data[0] > Data[1])
    return OBVData[0] = OBVData[1]+Volume;
  else if(Data[0] < Data[1])
    return OBVData[0] = OBVData[1]-Volume;
  else
    return OBVData[0] = OBVData[1];
}
Since it follows the sign of price changes, the OBV is correlated to the price curve. By the way, before you read further on, here’s a trick that can save money when you’re using the free Zorro version. Normally, volume and market depth are only available in Zorro S. But even the free version reads volume from online sources and stores it in historical data. So you only need to read it out of the history file and store it in a dataset, and can then access it in the script for any given bar with the dataFind function. 4 lines of code save EUR 35 per month.
For using OBV crossovers or price divergences for trade signals, the article author smoothed the OBV with an EMA and named it “OBVM”. The algorithm:
var OBVM(vars Prices, int Period)
{
   vars OBVData = series(OBV(Prices,marketVol()));
   return EMA(OBVData,Period);
}
For a crossover, naturally a second curve will be needed. Apirine invented the “OBVM Signal” by applying another EMA to the OBVM:
var OBVMSignal(vars OBVMData, int Period)
{
   return EMA(OBVMData, Period);
}
The resulting OBVM (blue) and OBVM Signal (red) curves with the S&P 500:
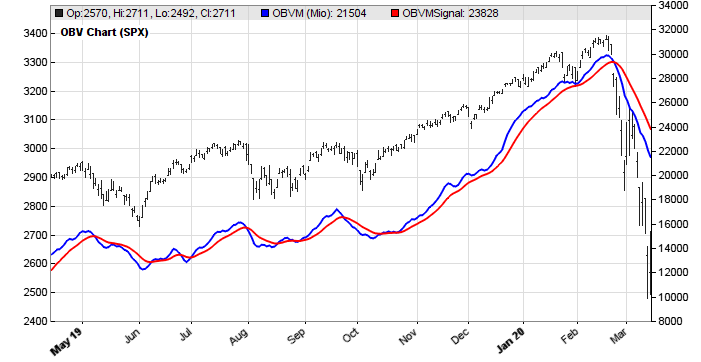
We’re now going to test the OBVM usefulness for trade signals. Following the author’s suggestions, we’ll use a crossover of the OBVM and the OBVM signal for entering a short or long SPY position. Of course it’s no problem to manually tweak the indicator and signal periods (7 and 10 in the chart above) until they produce great results. But that would not work in live trading, so we’re optimizing them with walk forward analysis. This is the C script for Zorro that trades SPY on SPX OBVM crossovers:
function run()
{
	set(PARAMETERS,LOGFILE,TESTNOW,PLOTNOW);
	BarPeriod = 1440;
	EndDate = 20200215;

	assetAdd("SPX","STOOQ:^SPX"); // load price history from Stooq
	assetAdd("SPY","STOOQ:SPY.US");
	asset("SPY");

	NumWFOCycles = 5; // activate walk forward analysis
	int ShortPeriod = optimize(7,3,20);
	int LongPeriod = ShortPeriod*optimize(1.3,1.1,2.0);

	asset("SPX");
	vars Prices = series(priceClose());
	vars OBVMData = series(OBVM(Prices,ShortPeriod));
	vars OBVMSignals = series(OBVMSignal(OBVMData,LongPeriod));

	asset("SPY");
	if(crossOver(OBVMData,OBVMSignals))
		enterLong();
	else if(crossUnder(OBVMData,OBVMSignals))
		enterShort();
}
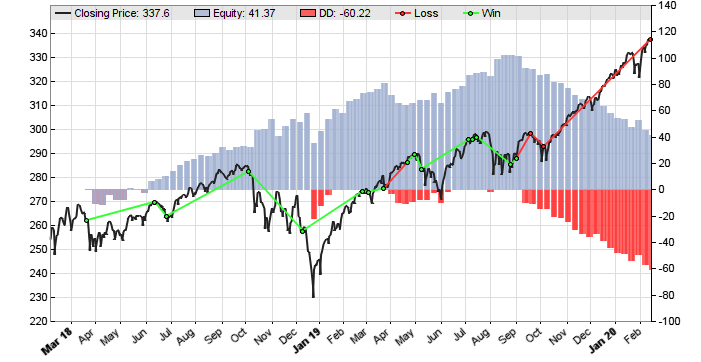
For ensuring that the long period is always longer than the short one, not the period itself, but a multiplication factor is optimized. After training, the system produces indeed a positive result. But the equity curve (blue bars) does not look very convincing:

We can see that the smoothed OBV crossover system is not really superior to a buy-and-hold strategy. But the author also recommended trading on divergence between the OBVM and the price curve. Maybe this produces a better result? The divergence trading system:
function run()
{
	set(PARAMETERS,LOGFILE,TESTNOW,PLOTNOW);
	BarPeriod = 1440;
	EndDate = 20200215;

	assetAdd("SPX","STOOQ:^SPX"); // load price history from Stooq
	assetAdd("SPY","STOOQ:SPY.US");
	asset("SPY");

	NumWFOCycles = 5; // activate walk forward analysis
	int ShortPeriod = optimize(7,3,20);
	int LongPeriod = ShortPeriod*optimize(1.3,1.1,2.0);

	asset("SPX");
	vars Prices = series(priceClose());
	vars OBVMData = series(OBVM(Prices,ShortPeriod));
	vars Highs = series(priceHigh()), Lows = series(priceLow());
	int Div = Divergence(Highs,Lows,OBVMData,LongPeriod);

	asset("SPY");
	MaxLong = MaxShort = 1;	// don't open several trades
	if(Div&1) // bullish divergence
		enterLong();
	else if(Div&2) // bearish divergence
		enterShort();
}
This system uses the Divergence indicator. The indicator draws lines between the most prominent recent peaks and valleys of the data series, and returns a result with several flags depending on which of the lines go in which different directions. The details of the Divergence function can be found in the Zorro manual under “Indicators”. After training again, we get this result:
Not much better than the crossover. But at least in the first part of the price curve, both tests produced a positive result. Maybe the indicator can be improved with a different signal generation method, a better smoothing function than EMA, and/or adding an anti-whipsaw or trend detection filter.
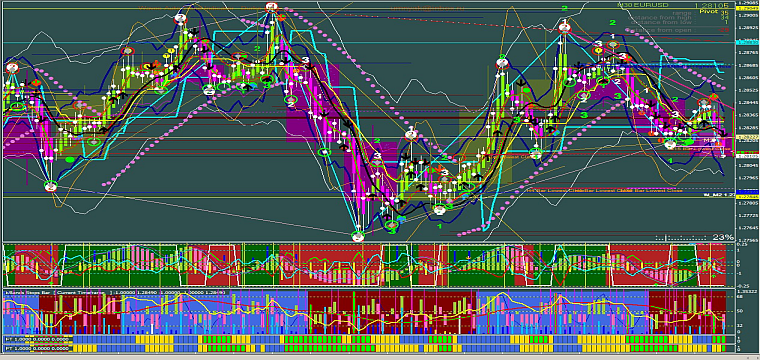
So when not directly for a trade system, how can you otherwise use the OBVM? The author knows the answer: “It is not a standalone indicator. As with all indicators, it is important to use OBVM in conjunction with other aspects of technical analysis”. Those other aspects are, of course, other indicators. Thats the beauty of technical analysis: Combine any two indicators and get a new one. And if in doubt, use it only in conjunction with other indicators. So just have many, many indicators. If possible in many, many different colors.
Reference
Vitali Apirine, On-Balance Volume Modified, Stocks&Commodities 4/2020
The indicator and test script is available in the Scripts 2020 repository.
Hi,
Maybe using tick volume would be an improvement.
Nice Petra.
Replace EMA with ALMA and there you go 🙂
I was thinking the same thing… using ALMA instead of EMA 🙂
Great work, Petra!
Issue with “many many indicators” is that really fast they start to contradict each other and you end up with no signals whatsoever. So you are forced to either pick & tune them very carefully to complement each other or start adding layers where some of them rule over others. But hey – I like Vitali’s ideas more than fib retracements!