
As an application to the windowing technique described the the previous article, John Ehlers proposed a new trend indicator that he claimed is robust and yet simple. The latter is certainly true, as the MAD (Moving Average Difference) oscillator is, as the name says, just the difference of two moving averages normalized to +/-100.
The MAD code in C for Zorro:
var MAD(vars Data, int ShortPeriod, int LongPeriod)
{
  return 100*(SMA(Data,ShortPeriod)/SMA(Data,LongPeriod)-1.);
}
Why do I do a division here instead of the supposed subtraction? It saves a function call and yields the same result, because (a-b)/b = a/b – 1.
According to Ehlers, the two periods should differ by half the period of the dominant cycle in the data. This ensures that the indicator output is in phase with the dominant cycle, thus indicating its trend with no lag. For putting that to the test, we apply an SMA 5-20 difference to a 30 period sine wave (code below):
function run()
{
 MaxBars = 200;
 asset(""); // dummy asset
 ColorUp = ColorDn = 0; // don't plot a price curve

 vars Sine = series(genSine(30,30));
 var Diff = SMA(Sine,5) - SMA(Sine,20);
 plot("Sine",Sine[0]-0.5,LINE,BLUE);
 plot("MAD",Diff,LINE,RED);
}
The resulting chart:
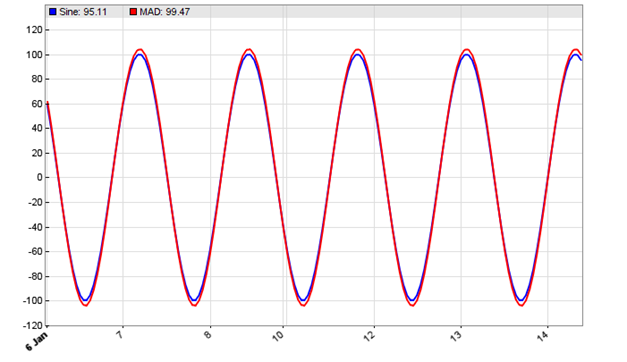
The chart displays the SMA 5-20 difference (red) applied to a 30 period sine wave (blue). We can see that the red difference is indeed exactly in sync with the blue sine wave.
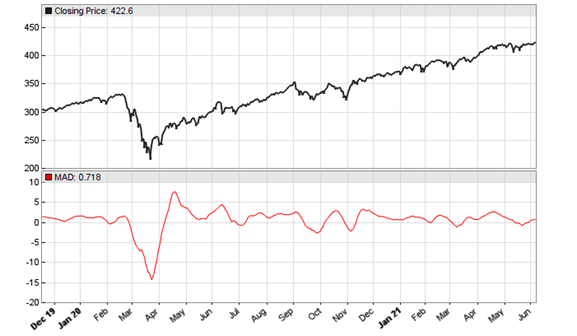
Now we apply the indicator to daily SPY data:
void run()
{
 StartDate = 20191201;
 EndDate = 20210701;
 BarPeriod = 1440;

 asset("SPY");
 plot("MAD",MAD(seriesC(),8,23),NEW,RED);
}
The resulting chart below matches Ehlers’ example in the S&C October issue. Note that his normalization by dividing through the longer SMA introduces a small phase shift. So the chart would look slightly different with a plain SMA difference.
Now let’s apply Ehlers’ Hann window technique, resulting in the MADH (MAD with Hann) indicator. We just glue both functions together:
var MADH(vars Data, int ShortPeriod, int LongPeriod)
{
 return 100*(SMA(hann(Data,ShortPeriod),ShortPeriod)
  /SMA(hann(Data,LongPeriod),LongPeriod)-1.);
}
This is the script for replicating Ehler’s chart in the S&C November issue, again with daily SPY data:
void run()
{
 StartDate = 20191201;
 EndDate = 20210701;
 BarPeriod = 1440;

 asset("SPY");
 plot("MAD",MAD(seriesC(),8,23),NEW,RED);
 plot("MADH",MADH(seriesC(),8,23),NEW,BLUE);
}
The resulting chart:
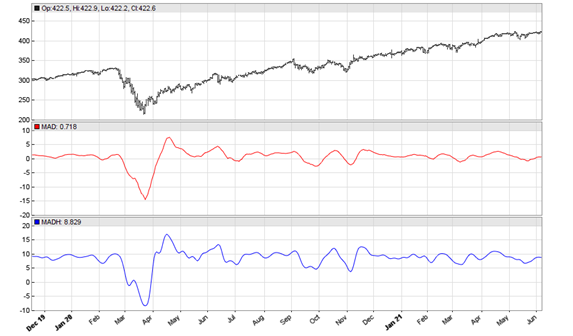
According to Ehlers, the MADH valleys and peaks are excellent buy and sell indications. Let’s not just take his word for it, but put it to the test. For this we add some buy and sell code to the end of the run() function:
vars Signals = series(MADH(seriesC(),8,23));
if(peak(Signals))
 enterShort();
else if(valley(Signals))
 enterLong();
Well. When you backtest that code, you’ll find that the MADH valleys and peaks are anything but excellent trade conditions. I do not print the equity curve here since it’s too depressing. Interestingly, the same system with the original MAD indicator produced a better result, although still not good enough for trading with real money. So whatever the MADH may be good for, I can not recommended to trade on its peaks and valleys, at least not with SPY 2019-2021. Maybe it works better with different parameters or other filter conditions.
The MADH oscillator and test script can be downloaded from the 2021 script repository.
As is explained in “An Introduction to Digital Signal Processing for Trend Following” (https://alphaarchitect.com/2020/08/13/an-introduction-to-digital-signal-processing-for-trend-following/), taking the difference between two moving averages with different lengths, as with the Moving Average Difference (MAD) indicator, results in a bandpass filter. A bandpass filter passes frequencies within a low and high cutoff frequency band (the bandwidth) and attenuates the others. The filter has a center (also called “resonant”) frequency between the two cutoff frequencies which it passes at maximum power. The filter bandwidth and center frequency are determined by the two moving average lengths. That is, the two moving average lengths “tune” the filter to a specific bandwidth and center frequency.
If you are able to identify the “dominant frequency” of an input signal, you can determine the two moving average lengths that will produce the desired bandwidth and center frequency, as illustrated in the 30 period sine wave example. However, financial time series are generally non-stationary, meaning that the dominant frequency changes over time. As a result, a bandpass filter with fixed coefficients will generally work better in certain time periods than others when used with a particular financial time series, but it will not perform well at all times with all time series for trading purposes. The dominant frequency of the input needs to be somewhat close to the bandpass filter center frequency, otherwise the filter output will lead or lag the input (often referred to as “divergence”), as is explained in the introduction to DSP article. Adding a window function, such as the Hann window, smooths the MAD indicator output but at the cost of some additional phase delay (lag), as will any window function (some more than others). There is an unavoidable tradeoff between smoothing and phase delay with any type of filter.
Note that the Moving Average Difference (MAD) indicator is basically the same as the Moving Average Crossover (MAC) indicator, just interpreted differently. It is also similar to the Moving Average Convergence-Divergence (MACD) indicator, which uses the difference between two exponential smoothing filters with different smoothing constants instead of two moving averages. The introduction to DSP article examines these and other popular technical indicators in detail.
It seems like all of Ehlers ideas falls apart when tested objectively.
Have you found any of his DSP work / indicators that are useful in an algo trading system? I have been banging my
Head against the wall and have tried various smoothers and filters.
Ehlers old indicators are absolutely useful, especially his frequency filters. We are using them all the time.
But it is indeed not so with his recently invented indicators. I have yet to see a useful application for them.
Well…
> According to Ehlers, the two periods should differ by half the period of the dominant cycle in the data.
I don’t think static 8-23 are a good representation of that.
After like 10 minutes of fiddling around – got some sort of success.
“`
function run()
{
set(NFA|PLOTNOW|PRELOAD|PARAMETERS);
BarPeriod = 30;
Outlier = 0;
LookBack = 320;
StartDate = 20210501;
EndDate = 20211231;
Lots = 10;
Verbose = 2;
MaxLong = MaxShort = 1;
var* Price = series(price());
var period = AutocorrelationPeriodogramCycle(Price); // that one from `Cycles for whatnot` book
vars Signals = series(MADH(Price,period*.5, period));
if(peak(Signals))
enterShort();
else if(valley(Signals))
enterLong();
}
“`
“`
madh compiling………..
Test: madh MATICUSDT 2021
Monte Carlo Analysis… Median AR 66%
Win 16.91$ MI 3.09$ DD 8.86$ Capital 34.40$
Trades 400 Win 47.5% Avg +42.3p Bars 14
AR 108% PF 1.22 SR 0.00 UI 0% R2 1.00
“`
PF 1.22 ain’t that bad for such a system.
@Sam
> Have you found any of his DSP work / indicators that are useful in an algo trading system?
yes
Tinkered bit more.
Somehow – hann window ain’t playing along.
In fact – MADH function straight up crashes for me like 3 times out of 5.
(could couple missing ticks cause division by zero? I’m too lazy to figure out)
Partly cause of crashes (not enough curve fitting) – pure MAD indeed looks more promising.
– 60 BarPeriod
– dominant cycle via Zorro’s inbuilt Hilbert Transform’s `DominantPeriod` w/ sensitivity on 27
> Trades 549 Win 48.6% Avg +51.9p Bars 5
> AR 221% PF 1.37 SR 0.00 UI 0% R2 1.00
But the actual reason why I’m writing this reply, @Sam, is…
`vars Signals = series(MAD(series(Smooth(Price, 6)),period*.5, period));`
With some slight smoothing my ground breaking back test numbers turn into:
> Trades 485 Win 48.2% Avg +70.2p Bars 5
> AR 263% PF 1.49 SR 0.00 UI 0% R2 1.00
P.s. My Sharpe Ratio is still bOrked.
When fed with a price series of zeros, MAD will indeed crash as you see in the code: division by zero. Many indicators crash on zeros, so rule #1 for a crash free system is don’t use it with a price of 0. But merely missing prices should be no problem.
I just noticed a potential crash by this line:
var period = AutocorrelationPeriodogramCycle(Price); // that one from `Cycles for whatnot` book
vars Signals = series(MADH(Price,period*.5, period));
I suppose that AutocorrelationPeriodogramCycle is similar to the Zorro DominantCycle function, but the returned cycle will then be different at each bar, while my hann() function allocated a fixed length series. Fix it by not using a fixed length:
vars hann(vars Data,int Length)
{
vars Out = series();
int i;
for(i=0; i<Length; i++)
Out[i] = Data[i] * (1-cos(2*PI*(i+1)/(Length+1)));
return Out;
}
So it’s not a zero price after all…
Tested. You are correct.
> var* Out = series(0,Length);
Crashes fixed.
Tricky series – sometimes I forget that Lite C compiles.
> I suppose that AutocorrelationPeriodogramCycle is similar to the Zorro DominantCycle function
Yes. But instead of Hilbert’s Transform it uses autocorellation or something (my memory is starting to fade) to detect dominant cycle length. Ehler advocates against usage of HT.
Sadly my implementation is sluggish and perhaps even faulty. But I did observe some really promising numbers here and there. I would be happy to see a blog post with a robust implementation of it. 😉
In other news:
vars Signals = series(PPO(smoothed, period*.5, period, MAType_SMA));
vars Signals = series(MAD(smoothed,period*.5, period));
I guess MAD sounds catchier.