
If indicators didn’t help your trading so far, just pimp them by preprocessing their input data. John Ehlers proposed in his TASC September article the windowing technique: multiply the input data with an array of factors. Let’s see how triangle, Hamming, and Hann factor arrays can improve the SMA indicator.
We are going to define some windowing functions that operate on a data series and thus can be applied to any indictor. First, the triangle:
vars triangle(vars Data, int Length)
{
  vars Out = series(0,Length);
  int i;
  for(i=0; i<Length; i++)
    Out[i] = Data[i] * ifelse(i<Length/2,i+1,Length-i);
  return Out;
}
The triangle factors are simply increasing until the middle of the Data series, then decreasing again. The function takes a data series and returns the modified data series. Next, the Hamming window:
vars hamming(vars Data, int Length, var Pedestal)
{
  vars Out = series(0,Length);
  int i;
  for(i=0; i<Length; i++)
    Out[i] = Data[i] * sin(Pedestal+(PI-2*Pedestal)*(i+1)/(Length-1));
  return Out;
}
This one produces a sine curve with a phase shift given by the Pedestal parameter. Finally, the Hann window that multiplies the data with a reversed cosine curve:
vars hann(vars Data, int Length)
{
  vars Out = series(0,Length);
  int i;
  for(i=0; i<Length; i++)
    Out[i] = Data[i] * (1-cos(2*PI*(i+1)/(Length+1)));
  return Out;
}
For testing the effect of windowing, we’re applying the 3 functions to the SMA of the SPY price curve derivative. The code and the resulting chart:
void run()
{
  StartDate = 20191101;
  EndDate = 20210101;
  BarPeriod = 1440;
  assetAdd("SPY","STOOQ:*"); // load data from STOOQ
  asset("SPY");

  vars Deriv = series(priceClose() - priceOpen()); // slope
  plot("FIR_SMA",SMA(Deriv,20),NEW,RED);
  plot("Triangle",SMA(triangle(Deriv,20),20),NEW,RED);
  plot("Hamming",SMA(hamming(Deriv,20,10*PI/360),20),NEW,RED);
  plot("Hann",SMA(hann(Deriv,20),20),NEW,RED);
}
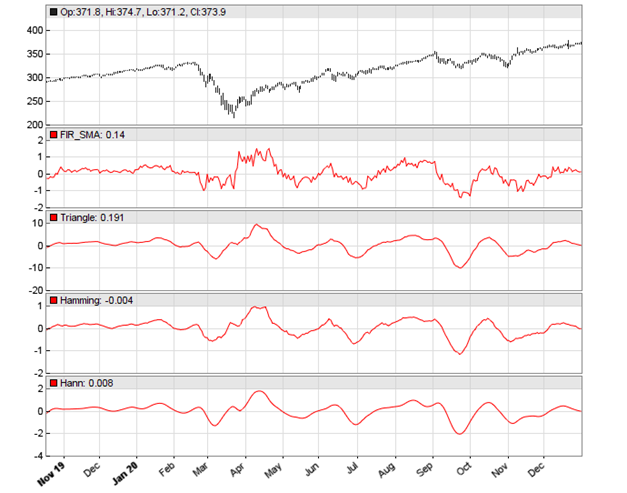
The chart displays at the top the original SMA, and below the SMA applied with a triangle, Hamming, and Hann data window. For testing the smoothness of the indicator, Ehlers used the rate-of-change (ROC) of the SMA. The code in C:
var ROC_SMA(vars Data,int Length)
{
  vars Filt = series(SMA(Data,Length),2);
  return Length/(2*PI)*(Filt[0]-Filt[1]);
}
Now we can replace the SMA in the above run() function with ROC_SMA. Again, first the original ROC_SMA, and below applied on a triangle, Hamming, and Hann data window:
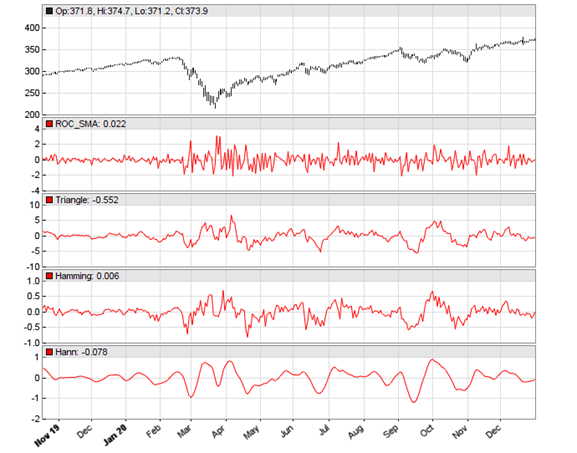
We see in the chart that the Hann window generates the smoothest curve, and this at no cost of lag. What can you now do with a Hann windowed indicator, such as the ROC_SMA of the SPY derivative? Well I think the same that you did with the original indicator, whatever it was, only better. The windowing functions and test script can be downloaded from the 2021 script repository.
You can read more about windowing functions here:
https://en.wikipedia.org/wiki/Window_function
I have a personal preference for a Blackman window.
Thanks for sharing Article. Please Click Trading website in India
I tested the Ehlers windowing indicators and it was worst than coin toss system.Firstly FIR_SMA peaks and valleys do not match with the peaks and valleys of the S&P data.The S&P price data is steep.We need a volatile, cyclistic data to test this system.
My question is how good is Blackman ,Hann,Hamming ,Triangle windows compare the moving average smoothing (Alma,super smoothing ,jurik etc.) or adaptive smoothing like whf adapting etc ?
Why should it “match the peaks and valleys” of the S&P? The indicators are applied on a derivative. This is not for matching peaks or valleys, or “moving average smoothing”.