
Compared to plain indicators, bands have the advantage that they look more colorful on charts. And they offer more lines to trigger trade signals. In this way, bands beat any old single-line indicator hands down. This was also noticed by Vitali Apirine, who invented in the Stocks&Commodities August 2021 issue a new sort of bands.
Vitali’s Moving Average Bands are like Bollinger Bands without the standard deviation. Instead the difference of two exponential moving averages is used. The code in C for Zorro:
var MAB(int Period1,int Period2,var Mltp)
{
 var MA1 = EMA(seriesC(),Period1);
 var MA2 = EMA(seriesC(),Period2);
 var Dst = MA1-MA2;
 var Dv = SMA(series(Dst*Dst),Period2);
 var Dev = sqrt(Dv)*Mltp;

 rRealMiddleBand = MA1;
 rRealUpperBand = MA1+Dev;
 rRealLowerBand = MA1-Dev;
 return MA2;
}
The 3 variables rRealMiddleBand, rRealUpperBand, rRealLowerBand are predefined Zorro variables for band indicators. Here’s the code to reproduce the author’s NASDAQ chart:
function run()
{
 StartDate = 20111201;
 EndDate = 20130815;
 BarPeriod = 1440;
 LookBack = 300;

 asset("NAS100");
 var Signal = MAB(200,50,1);

 plot("MA2",Signal,LINE,BLUE);
 plot("MAB1",rRealUpperBand,BAND1,RED);
 plot("MAB2",rRealLowerBand,BAND2,RED|TRANSP);
}
This code generates the chart below, with the NASDAQ price curve from 2012 to mid-2013, and the parameters (200,50,1) for the slow and fast MA and the deviation multiplier:
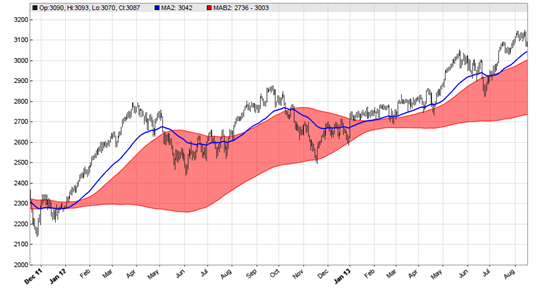
The blue line is the fast MA. The author suggests to use the crossing of this line with the upper and lower band for buy and sell signals. To put that to the test, we increase the backtest period to 10 years and add the following code:
vars Signals = series(Signal);
MaxLong = MaxShort = 1;

if(crossOver(Signals,rRealUpperBand))
 enterLong();
if(crossUnder(Signals,rRealUpperBand))
 exitLong();
if(crossUnder(Signals,rRealLowerBand))
 enterShort();
if(crossOver(Signals,rRealLowerBand))
 exitShort();
The system is indeed profitable – sort of. It generates the equity curve below from 14 NASDAQ trade signals between 2011 and 2021 with the author’s MAB parameters:
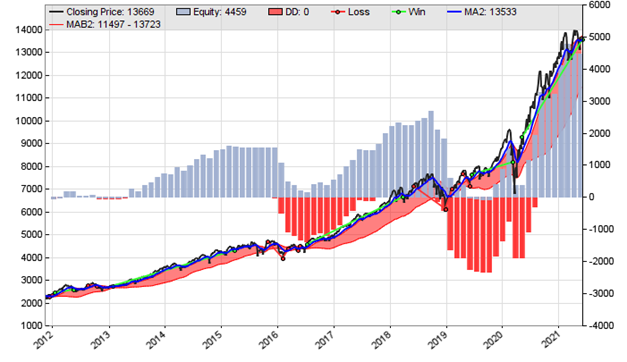
This bumpy system would require strong nerves, since it lost twice almost all capital. But as the author never gets tired of mentioning, you need a lot more indicators on your chart when you really want to trade. So the test was sort of unfair.
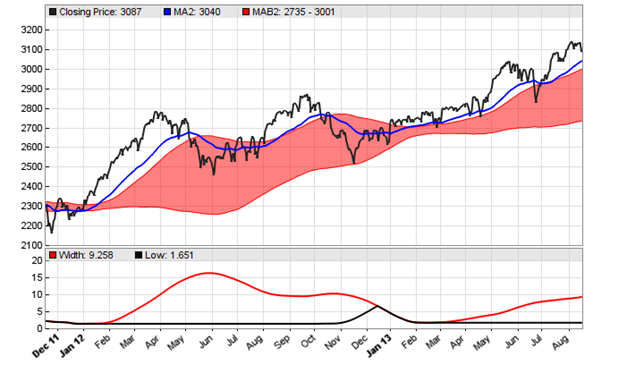
In part 2 of his article, the author suggests to use the width of the band as an additional indicator for finding trend changes or consolidations, and its 200 days low as another additional indicator. The code below plots the width and low within the last slow period:
var Bndw = 100*(rRealUpperBand-rRealLowerBand)/rRealMiddleBand;
plot("Width",Bndw,NEW|LINE,RED);
plot("Low",MinVal(series(Bndw),200),LINE,BLACK);
The resulting chart displays the band width (red) and the 200 days low (black) in the additional window below the main chart:
How do you now implement the band width or its low line in a trading system? Here the author remains vague, only sure thing is that you will need many, many more indicators. I am confident that Vitali will provide an ample supply of those indicators in his future articles. If you have ambitions: The MA Band indicator and system can be downloaded from the 2021 script repository.
is it not a sort of MACD line crossing strategy ? missing the bumps eating the downs.