
There’s no doubt that buying and holding index ETFs is a long-term profitable strategy. But it has two problems. It does not reinvest profits, so the capital grows only linearly, not exponentially. And it exposes the capital to the full rollercoaster market risk. A sure way to go out of the market in a downtrend, and invest the profits back in an uptrend would be (almost) priceless. Markos Katsanos promises no less in his Stocks&Commodities July 2021 article. Does this really work?
Markos’ buy-and-sell system with stock index ETFs uses the VIX as a volatility indicator for predicting downtrends. The system is a veritable indicator soup, with no less than 15 separate buy and sell conditions. Fortunately his published Amibroker code can be easily converted to C:
function run()
{
 StartDate = 20101231;
 EndDate = 20201231;
 BarPeriod = 7*1440; // 1 week
 LookBack = 100;
 Capital = 100000;

 set(PARAMETERS,TESTNOW,PLOTNOW);
 setf(PlotMode,PL_ALL);
 PlotScale = 8;

 asset("VIX");
 var VIXdn = (price(0)/HH(15,1)-1)*100;
 var VIXup = (price(0)/LL(15,1)-1)*100;
 var VIXDnMin = -optimize(30,20,40,10);
 var VIXUpMin = optimize(100,80,120,10);
 plot("VIX",price(0),NEW,BLACK);

 asset("SPY"); // use unadjusted data!
 vars SPYs = series(priceClose());
 vars Vols = series(marketVol());
 vars ATRs = series(ATR(2));
 var ATRDn = (ATRs[0]/MaxVal(ATRs+1,15)-1)*100;
 var ATRUp = (ATRs[0]/MinVal(ATRs+1,15)-1)*100;
 var Up = (HH(2)/LL(4)-1)*100;
 var Dn = (LL(2)/HH(4)-1)*100;
 var Cch = (LL(10)/HH(100)-1)*100;
 vars StochK14s = series(StochK(14,3));
 vars StochK40s = series(StochK(40,3));
 int HHb = MaxIndex(SPYs,4);
 int LLb = MinIndex(SPYs,4);
 var VOLUp = (Vols[0]/SMA(Vols+HHb+1,50)-1)*100;
 plot("Volume",Vols,BARS|NEW,BLUE);
 plot("ATR(2)",ATRs,LINE|NEW,RED);

 int BuyInitial = once(
   SMA(SPYs,10) >= SMA(SPYs+1,10) &&
   StochK(3,3) < 40);
 int Buy = Up > 6 &&
   (VIXdn < VIXDnMin or ATRDn < 2*VIXDnMin) &&
   Cch < -15 &&
   MinVal(StochK40s,LLb) < 25 &&
   MinVal(StochK14s,LLb) < 25 &&
   StochK14s[0] >= StochK40s[0];
 int Sell = SPYs[0] < SMA(SPYs,20) &&
   Dn < -6 &&
   (VIXup > VIXUpMin or ATRUp > 2*VIXUpMin) &&
   VOLUp > 80 &&
   MaxVal(StochK40s,HHb) > 85 &&
   MaxVal(StochK14s,HHb) > 85 &&
   StochK14s[0] <= StochK40s[0];

 MaxLong = 1;
 Leverage = 1;
 Margin = Equity; // invest all money
 Fill = 3; // enter/exit at next open
 if(Sell)
   exitLong();
 else if(BuyInitial or Buy)
   enterLong();

//plot tiny triangles for the buy and sell signals
 if(Buy)
   plot("Buy",0.9*priceLow(),MAIN|TRIANGLE,GREEN);
 if(Sell)
   plot("Sell",1.1*priceHigh(),MAIN|TRIANGLE4,RED);

}
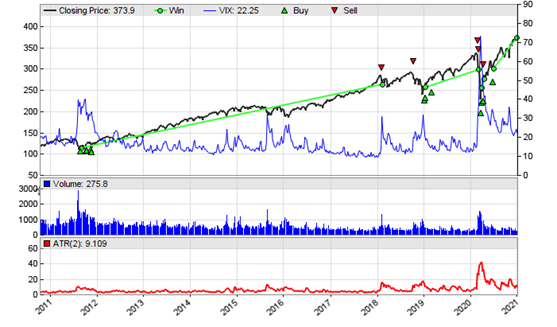
The initial buy condition is required, otherwise the system would stay out of the market for a long time. The once(..) function is used for such initializations; it returns true when its argument becomes nonzero the first time during a backtest or trading session, and false afterwards. On the chart we can see that the system is indeed only in the market when SPY rises. The blue line is the VIX, the tiny red and green triangles are the buy and sell signals. They appear well placed.
This is, of course, an in-sample result. With only 3 trades, WFO would be futile. For your experiments please be aware that the above setup, derived from the author’s Amibroker code, must be exactly reproduced for getting the same result. Tiny deviations, such as using adjusted instead of unadjusted SPY data, shifting the bars by a few hours, or using a slightly different Stoch variant, produced a quite different backtest. This hints that there’s still room for improvement with this strategy, to say the least. The above code is more an exercise in 1:1 conversion from another platform, than a real trading system. But the basic idea of buy-and-sell is certainly good, as is the idea to use the VIX for downtrend detection. Maybe someone can come up with a more simple and more serious variant of this system that would be suited for a WFO test.
The Buy-Sell system can be downloaded from the 2021 script repository. Since it is based on 1-week bars and uses market volume, you need Zorro S 2.38 or above to run it. Or even better, convert it to daily bars. Personally I see no reason for using 1-week bars in any trading system.
“With four parameters I can fit an elephant, and with five I can make him wiggle his trunk.” John von Neumann
“Tiny deviations, such as using adjusted instead of unadjusted SPY data, shifting the bars by a few hours, or using a slightly different Stoch variant, produced a quite different backtest. This hints that there’s still room for improvement with this strategy, to say the least.”
No it doesn’t , what it indicates is something that isn’t robust and is likely curve fitted beyond uselessness except for making good grist for readers that don’t know better .
Wow, nothing escapes you, does it? 🙂
Hi Petra, thanks for the article.
I don’t really follow this one:
“It does not reinvest profits”.
If you just plot SPY with the log price scale you will see a straight(ish) line. Meaning it IS exponential.
So basically in Buy and hold, profits are re-invested automatically while the position is held.
This is even regardless of using adjusted (dividends reinvested) or not-adjusted (dividends withdrawn) price history versions.
So I don’t quite follow this one if you could elaborate.
Certainly. I learned that trading usually involves buying something, then selling it. If it was bought cheaper than sold, the difference is commonly named “profit”. If you can use this “profit” to buy more, this activitiy is commonly referred to as “reinvesting profit”. If you only buy and do not sell, you obviously cannot “reinvest profit”. Hope this helps.
“It does not reinvest profits, so the capital grows only linearly, not exponentially.” really?
If you buy and hold an asset that grows 5% per year, that’s exponential growth …
If such an asset existed, we all would be rich 🙂
https://www.google.com/finance/quote/SPY:NYSEARCA?sa=X&ved=2ahUKEwjQqu_l5YH4AhWEtqQKHVW6DZ8Q3ecFegQICRAg&window=1Y
Indexes can go anytime in any direction with any growth rate. That’s just the market. Its why people trade. No asset has an exponential growth law. Not even bitcoin.