
The previous article dealt with John Ehlers’ AM and FM demodulating technology for separating signal and noise in price curves. In the S&C June issue he described a practical example. Applying his FM demodulator makes a strategy noticeably more robust – at least with parameter optimization.
The simple example strategy is basically a short-term trend follower. The price curve is differentiated, then integrated again for removing the zero frequency part. The result is smoothed, and the system trades on zero crossings of its rate of change. Two parameters, the smoothing period and the rate-of-change period, are optimized. The code in C for Zorro:
void simple()
{
  int SigPeriod = optimize(8,6,14,1),
    ROCPeriod = optimize(1,1,6,1);
//Derivative of the price wave
  vars Deriv = series(priceClose(0)-priceClose(2));
//zeros at Nyquist and 2*Nyquist, i.e. Z3 = (1 + Z^-1)*(1 + Z^-2)
  vars Z3 = series(Sum(Deriv,4));
//Smooth Z3 for trading signal
  vars Signal = series(SMA(Z3,SigPeriod));
//Use Rate of Change to identify entry point
  vars Roc = series(Signal[0]-Signal[ROCPeriod]);
//If ROC Crosses Over 0 Then Buy Next Bar on Open;
//If Signal Crosses Under 0 Then Sell Next Bar on Open;
  if(crossOver(Roc,0))
    enterLong();
  else if(crossUnder(Signal,0))
    exitLong();
}
For replicating Ehlers’ results we use brute force in-sample optimization. This results in an impressive profit factor of almost 3 when applied to the S&P500 index (SPY) from 2009 to 2021. Still, the equity curve below shows that the main profit results from the last 2 years. So this is, as Ehlers admitted, not a very robust system.
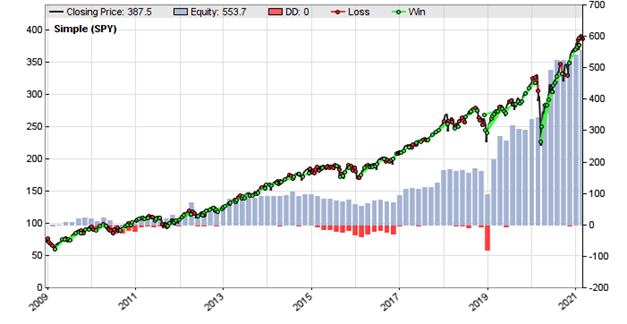
Figure 1 – Simple system with no FM demodulator
Now we’re going to improve the system by inserting Ehler’s FM demodulator from the previous article. The code in C for Zorro:
void simpleFM()
{
  int i, SigPeriod = optimize(8,6,14,1),
  ROCPeriod = optimize(1,1,6,1);
//Derivative of the price wave
  vars Deriv = series(priceClose(0)-priceClose(2));
//FM filter: normalize Derive to half RMS and hard limit at +/- 1
  var RMS = 0;
  for(i=0; i<50; i++) RMS += Deriv[i]*Deriv[i];
  vars Clips = series(clamp(2*Deriv[0]/sqrt(RMS/50),-1,1));
//zeros at Nyquist and 2*Nyquist, i.e. Z3 = (1 + Z^-1)*(1 + Z^-2)
  vars Z3 = series(Sum(Clips,4));
//Smooth Z3 for trading signal
  vars Signal = series(SMA(Z3,SigPeriod));
//Use Rate of Change to identify entry point
  vars Roc = series(Signal[0]-Signal[ROCPeriod]);
//If ROC Crosses Over 0 Then Buy Next Bar on Open;
//If Signal Crosses Under 0 Then Sell Next Bar on Open;
  if(crossOver(Roc,0))
    enterLong();
  else if(crossUnder(Signal,0))
    exitLong();
}
The FM demodulator is basically the clamp() function, which removes the amplitude from the price curve derivative, in combination with the subsequent SMA, which acts as a lowpass filter. The result after brute force optimization:
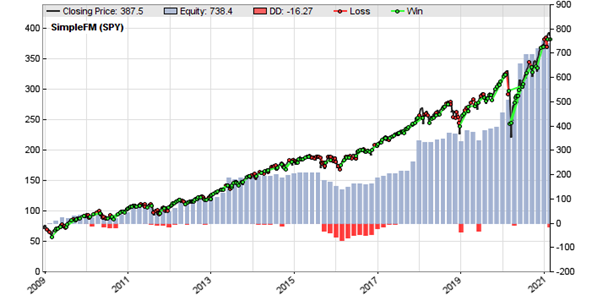
Figure 2 – Simple system with FM demodulator
The profit factor is still about the same, slightly below 3, but the equity curve now looks a bit better and the total profit is higher. Ehlers attributed the increased robustness to the more linear parameter surface. For verifying that, we compare the 2D parameter charts from both versions:
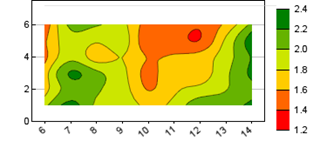
Figure 3 – Parameter heatmap, no FM demodulator
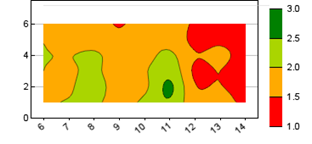
Figure 4 – Parameter heatmap, with FM demodulator
The charts display the performance dependent on the parameter values on the y and x asis. We can see that the FM demodulator version has indeed the smoother heatmap with a top (green) in the center of the parameter ranges. The heatmap of the other system looks crumpled with a deep valley in the center and several tops apart from each other. Clearly the optimization of the FM demodulator system was more effective.
Further reading: John Ehlers, More Robust Strategies, Stocks & Commodities June 2021.
The script can be downloaded from the 2021 script repository. You will need Zorro S 2.37 or better for the brute force optimization and the 2D parameter charts.
How would you use this to filter trades in a system? What does the FM value represent? Is it just the Rate of change of price ?
Is there a way to filter trend vs cycle modes in the market and calculate signal-to-noise ratio?
Thanks for another interesting article. I am a full-time trading system developer since 2008 and am following your blog for a few years already. I much appreciate all your content and have learned a lot from you. So, big thanks for that! Interestingly, I have just published an article about stability too, maybe it is interesting for you in some way, given that I have developed a right now pretty well-working forex trading system called “Invesard GBPUSD” (http://invesard.trade) with that approach: https://www.mql5.com/en/blogs/post/743976
By the way, the data used to create this system and which the article is based on, is my own collected which you can find over here if it helps anything: https://www.forexfactory.com/thread/post/13489552
Thank you again and keep up the good work,
Geektrader
Thanks! Sam: The FM demodulator is not for filtering trades or detecting trend vs cycle. In this system it filters the used signal, the price rate of change, out of the price curve.
Hi,
Regarding your book:-
1) How does your book content different from what your posted here ?
2) Each 1-2 month, you add/share new topics on this forum. Your book won’t include new topics as it is already published. One cannot afford to buy new editions.
3) Is it a must to buy from Amazon, etc. ? Sometimes Amazon ship damaged book copies to customers.
Which website is cheapest ?
Thanks,
HK
This blog deals with specific topics, the book with general strategy development. If you are a seasoned developer and have no problem to understand the code here, you won’t need the book.
Thanks for clarification. In this case, I just stick with your blog. Reason not that I am miser but to be frank, many so-called training out there are just for beginners and there is no specific in-depth topic like yours with result-shown after simulation/running the codes, etc. Put it bluntly, they just sell education or MT4/Multi-chart software.
There is one important topic nobody ever touches on but elementary. Many traders here looking your blog are retail ones or amateur (maybe have a job but wish to explore your stuff as passive income), they do not wish to invest lot of money on network. These days, I experience my internet being cut off usually in the morning (perhaps signal being blocked, etc.). It cannot automatically connect.
Thus, I think in my 2-cents it is important to run these strategies on cloud and not on the traders’ local PC. What’s your thought ? Which brokers provide such cloud service is a mystery.
You should definitely run them on the cloud. There are many services available, with Amazon and Google it’s even free for the first year.
This tab is supposed for “More Robust Strategies”. Apology to other readers as my message is not relevant to the topic.
Yes, I know that Amazon & Google provide such free of charge cloud service. But what about if somebody stole your account password ?
That someone would get rich and you poor. Possibly.