
Price curves consist of much noise and little signal. For separating the latter from the former, John Ehlers proposed in the Stocks&Commodities May 2021 issue an unusual approach: Treat the price curve like a radio wave. Apply AM and FM demodulating technology for separating trade signals from the underlying noise.
A very simple AM (amplitude modulation) receiver is just an antenna, a rectifier, and a capacitor. In programming, a rectifier is equivalent to the absolute value and a capacitor to taking the envelope of a wave. For the envelope we’re using the maximum of the last 4 values, smoothed with a moving average. Here’s the indicator equivalent of an AM radio in C for Zorro:
var AM(var Signal, int Period)
{
  var Envelope = MaxVal(series(abs(Signal)),4);
  return SMA(series(Envelope),Period);
}
For making a FM (frequency modulation) radio, we first remove the amplitude and integrate the remaining frequency signal with a lowpass filter. For removing the amplitude we’ll clamp the signal to +/-1. For the integration we’re going to use Ehlers’ Super Smoother, which fortunately already exists in Zorro’s indicator library. The code:
var FM(var Signal, int Period)
{
  var HL = clamp(10*Signal,-1,1);
  return Smooth(series(HL),Period);
}
Ehlers used the derivative of the price curve for the incoming signal. The derivative is equivalent to the price change per bar. We can now write the script for generating FM and AM charts of the SPY price curve:
void run()
{
  BarPeriod = 1440;
  StartDate = 20180701;
  EndDate = 20201201;

  assetAdd("SPY","STOOQ:*"); // load price history from Stooq
  asset("SPY");

  var Deriv = priceClose()-priceOpen();
  plot("Deriv",Deriv,NEW,BLACK);
  plot("AM",AM(Deriv,8),NEW,RED);
  plot("FM",FM(Deriv,30),NEW,BLUE);
}
The resulting chart shows the derivative and the AM (red) and FM (blue) decoded signals:
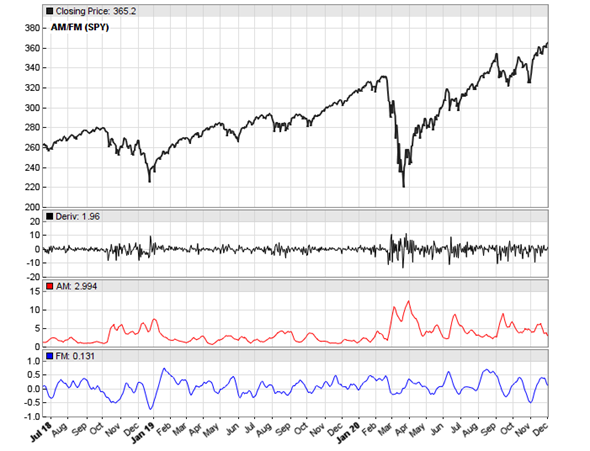
We can see in the chart that the AM signal looks like a proxy of volatility, and the FM signal appears to measure the rate of price variations. But how can we apply this technology for improving a real trading system? This will be the topic of the next article of this series.
The AM and FM indicators and the script can be downloaded from the 2021 script repository.
Great interpretation on the latest article of Ehlers, can’t wait to read the next article Petra!
The low pass & high pass filters + smoothing func are quite good to play around too, But I haven’t been able to synthesize it’s meaning (which probably means I do not fully understand it quite yet). Maybe a suggest on a future article if you find it interesting.
Cheers! ??