
Vitali Apirine, inventor of the OBVM indicator, presented another new tool for believers in technical analysis. His new Compare Price Momentum Oscillator (CPMO), described in the Stocks & Commodities August 2020 issue, is based on the Price Momentum Oscillator (PMO) by Carl Swenlin. Yet another indicator with an impressive name. But has it any use?
The PMO is the EMA of the EMA of the 1-day rate-of-change (ROC) of a stock or index price, multiplied with 10. Since his inventor Swenlin used a nonstandard EMA formula, the two EMA periods, supposed to be 35 and 20, are in fact 34 and 19. I also am not sure why he multiplied the result with 10 – but who am I to doubt? Once an indicator is established, we must stick with its formula, no matter if it resulted from a typo, from not knowing the EMA formula, or from whatever else.
The PMO code in C:
var PMO(vars Data) { return 10*EMA(EMA(ROC(Data,1),34),19); }
(If you know Zorro indicators and wonder why it’s not EMA(series(EMA(series(ROC(... – both is possible, but since Zorro 2.28 the EMA function also accepts single values instead of series.)
Apirine’s CPMO is no new indicator, but a comparison of two index PMOs in hope of deriving useful information from their divergences or crossing points. The author gave several examples in his magazine article. We’re replicating one of them, the PMOs of the Consumer Discretionary Select Sector (IXY) and the Consumer Staples Select Sector (IXR) compared with the trend of the S&P 500 index (SPX). Below is the code. It retrieves the historical data from Stooq and Yahoo:
function run()
{
  BarPeriod = 1440;
  assetAdd("SPX","STOOQ:^SPX");
  asset("SPX");
  assetAdd("IXY","YAHOO:IXY");
  asset("IXY");
  vars PricesIXY = series(priceClose());
  assetAdd("IXR","YAHOO:IXR");
  asset("IXR");
  vars PricesIXR = series(priceClose());

  plot("IXY",PMO(PricesIXY),NEW|LINE,GREEN);
  plot("IXR",PMO(PricesIXR),LINE,RED);
}
The script produces this chart:
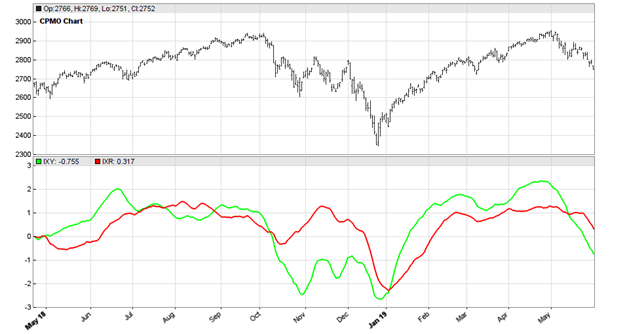
According to the author, the IXR-IXY PMO crossings identify changes in investor sentiment and therefore indicate upcoming SPX trend. Indeed they do in the selected chart, although with some delay and only three out of five times. So it’s hard to judge the CPMO’s usefulness in that context. But as the author says: CPMO […] should be used in conjunction with other indicators like moving averages, chart patterns, or other forms of technical analysis.
Add enough other indicators, and you will succeed. Maybe. For your own experiments, the PMO indicator and script can be downloaded from the 2020 script repository.
Really like reading those, wondered since a long time why you didn’t publish there.
Nice you do now, keep up that great work.