
It is estimated that about 6000 different technical indicators have been meanwhile published, but few of them are based on volume. In his article in Stocks & Commodities April 2021, Markos Katsanos proposed a new indicator for detecting high-volume breakouts. And he tested it with a trading system that I believe is the most complex one ever posted on this blog.
The VPN indicator calculates the difference of up day volume and down day volume, divided by the total volume. A day is an up day when its typical price – the average of high, low, and close – is higher than yesterday’s typical price plus 1/10 ATR. The opposite is true for down days. The result is multiplied by 100 and smoothed with a 3-day EMA. The C code of this indicator:
var VPN(vars Volumes,int Period)
{
  var Dist = 0.1*ATR(Period);
  vars TypPrices = series(TypPrice());
  var Vp=0,Vn=0,Vtotal=0; int i;
  for(i=0; i<Period; i++) {
    if(typprices[i] > TypPrices[i+1] + Dist)
      Vp += Volumes[i];
    else if(TypPrices[i] < TypPrices[i+1] - Dist)
      Vn += Volumes[i];
    Vtotal += Volumes[i];
  }
  return EMA(100*(Vp-Vn)/Vtotal,3);
}
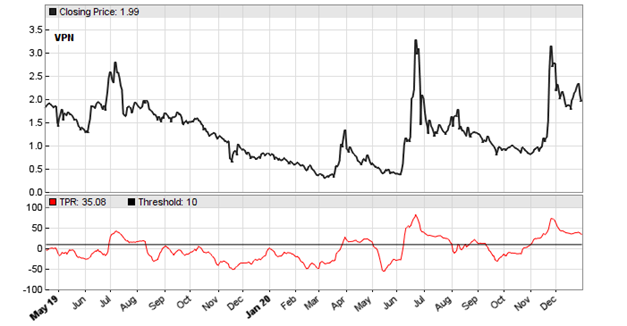
The author published a chart with the VPN applied to Ideanomics Inc. (IDEX), a supplier to electric vehicles. The code for replicating his chart:
void run()
{
  BarPeriod = 1440;
  StartDate = 20190501;
  EndDate = 20201231;

  assetAdd("IDEX","STOOQ:IDEX.US");
  asset("IDEX");

  vars Volumes = series(marketVol());
  plot("TPR",VPN(Volumes,30),NEW,RED);
  plot("Threshold",10,0,BLACK);
}
The resulting chart is displayed with a threshold line at 10%. The VPN crossing this line is supposed to be a buy signal. We can see that the signals are valid, but a bit late. They catch only the top of the price peaks. It would be possibly better to smooth the indicator not with an EMA, but with a filter with less lag, such as a 2-pole lowpass filter or one of Ehlers’ zero-lag filters.
How does the VPN fare in a trading system? When I test a new indicator, I normally use first a simple system with no filters, bells, or whistles for finding out if it has predictive power at all. But this is not what the author did. For testing the VPN, he invented a 2000 stocks portfolio system with the following rules:
Buy when the VPN crosses over 10% and its 50-day volume average is above its previous 50-day average, its 5-day RSI below 90, and the price above its 30-day SMA. Close open positions after 15 days, or when the VPN crosses below its 30-day SMA while the price is more than 3 ATR below its 5-day high, or when a COVID market crash is imminent. A COVID crash is predicted by a 15% Russell2000 drop and a value below the 150-day SMA. Assets are filtered out when their price was below 1 or their 5-day average volume below 100000 or the product of price and volume below 500000.
I am sure that those hand tailored rules would already produce a great backtest, no matter with which indicator. Additionally, the author optimized the VPN period, the trade lifetime, and the VPN threshold. Although his AmiBroker platform supports out-of-sample optimization, he optimized the whole backtest period and then picked the best parameters manually from the optimization chart.
In our replication of his test, we’ll use walk-forward optimization for getting a more serious result. As in the AmiBroker code, we invest 10,000 per stock and allow a maximum of 10 open positions. For comparison with a benchmark, we invest the same amount in IWM, the Russell2000 index ETF. As one can expect from the description, the C code is a bit lengthy:
#define CAPITAL 10000
#define MAXTRADES 10

void run()
{
  NumWFOCycles = 5;
  BarPeriod = 1440;
  StartDate = 2011;
  EndDate = 2021;
  LookBack = 150;

  setf(TrainMode,SETFACTORS); // skip OptimalF calculation
  UpdateDays = 5; // don't download all again every day
  assetList("AssetsRussell2000");
  assetAdd("IWM","STOOQ:IWM.US"); // Russell2000 index ETF

  set(PARAMETERS);
  int Period = optimize(30,30,40,10);
  var Threshold = optimize(10,10,20,10);

// Sell after 15 days,
// or when a Russell2000 15% drop and a value below the 150-day SMA indicates meltdown.
  LifeTime = optimize(15,5,70,5);
  asset("IWM");
  int Meltdown = ROC(seriesC(),10) < -15 && priceClose() < SMA(seriesC(),150);

// Use Russell2000 index (IWM) for a benchmark line
  setf(PlotMode,PL_ALL|PL_BENCHMARK);
  static var StartPrice;
  if(is(LOOKBACK)) StartPrice = priceClose();
  var Benchmark = MAXTRADES*CAPITAL/priceClose() * (priceClose()-StartPrice);
  plot("Russell2000",Benchmark,AXIS2,PURPLE);

  for(listed_assets)
  {
    asset(Asset);
    if(Asset == "IWM") continue; // don't trade the index
    vars Volumes = series(marketVol(0),100);
    vars Prices = series(priceClose(),30);
    vars Signals = series(VPN(Volumes,Period),2);

// Filter out when price was below 1
// or 5-day average volume below 100000
// or the 5-day average product of price and volume below 500000.

    bool Filter = Prices[0] < 1
      || SMA(Volumes,5) < 100000
      || SMA(series(Volumes[0]*Prices[0],5),5) < 500000;

// buy when the VPN crosses over 10%
// and its 50-day volume average is above its previous 50-day average,
// its 5-day RSI is below 90, and the price is above its 30-day SMA.

    bool Buy = crossOver(Signals,Threshold)
      && SMA(Volumes,50) > SMA(Volumes+50,50)
      && RSI(Prices,5) < 90
      && Prices[0] > SMA(Prices,30);

// Sell when the VPN crosses below 30-day SMA while price is more than 3 ATR below 5-day high,
// or when a market meltdown is immiment

    bool Sell = (crossUnder(Signals,SMA(Signals,30))
      && Prices[0] < HH(5) - 3*ATR(5)) || Meltdown;

    if(!Filter && Buy && !Sell && (Train || NumLongTotal < MAXTRADES))
      enterLong(CAPITAL/Prices[0]);
    else if(Sell)
      exitLong();
  }
}
I have added code comments for the various buy, sell, and filter conditions. The first start of this system will be slow because the histories of all 2000 stocks are downloaded. The Russell2000 asset list is set up to load them from Yahoo. Subsequent starts are faster. I’ve used UpdateDays = 5 so that only every 5 days all the stocks are re-loaded. Setting SETFACTORS in TrainMode is a trick to prevent OptimalF calculation, which is not needed here and would take a long time with this many stocks and trades. The NUMTRADES limit is overridden in Train mode for getting more trades and thus better parameter quality.
The profit curves are plotted to the chart below, blue for the trading system and purple for the Benchmark.
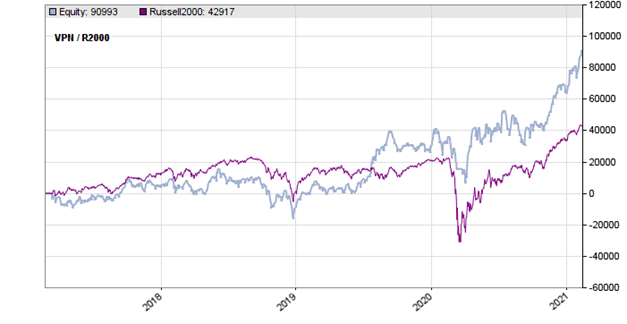
Although we used 10 years history, the backtest starts only 2017 due to the preceding WFO training periods. We can see that the VPN based trading system indeed beats the benchmark, but not really convincingly so – in the first years it actually trailed the IWM. Clearly, we could produce better backtests by in-sample optimization and hand picking parameters. Only problem is that they would be useless.
The VPN indicator and the trading system can be downloaded from the 2021 script repository. You need Zorro S 2.36 or newer for this system.
Thank You , for this innformative post.