
Financial markets are not stationary: Price curves swing all the time between trending, mean reverting, or entirely random behavior. Without a filter for detecting trend regime, any trend following strategy will bite the dust sooner or later. In Stocks & Commodities February 2021, Richard Poster proposed a trend persistence indicator for avoiding unprofitable market periods.
The TPR (Trend Persistence Range) indicator measures the steepness of a SMA slope and counts the bars where the slope exceeds a threshold. The more steep bars, the more trending the market. The C code of this indicator:
var TPR(vars Data,var Threshold,int TPRPeriod,int SMAPeriod)
{
  vars SMAs = series(SMA(Data,SMAPeriod));
  int i, CtrP=0, CtrM = 0;
  for(i=0; i<TPRPeriod; i++) {
    var Slope = SMAs[i]-SMAs[i+1];
    if(Slope > Threshold) CtrP++;
    else if(Slope < -Threshold) CtrM++;
  }
  return 100. * abs(CtrP-CtrM)/TPRPeriod;
}
The TPR function gets threshold, counting period, and SMA period as parameters. The author published a chart with the TPR applied to EUR/USD 1-hour bars. He apparently smoothed the TPR output with some filter, but did not mention which one. For replicating his chart, I assumed that he used a simple EMA(5) and a 1 pip threshold. The resulting chart:
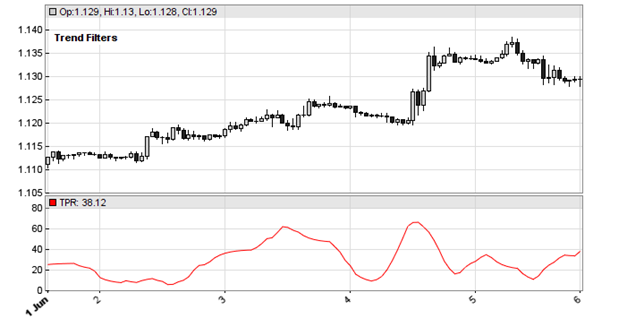
This looks as if trends were indeed well detected. But how does the TPR fare as a trend filter in a real trading system? The author published results from a SMA crossover strategy with his TPR in comparison with several other filters – and of course the TPR won hands down. But I fear this result has to be taken with a grain of salt, because he optimized the filter parameters using the MT4 platform. This means the results are distorted by in-sample optimization, the only “optimization” MT4 can do.
For testing the TPR, here’s the C code of a basic SMA crossover system with 3 different algorithms: no filter, TPR filter, and Ehler’s Correlation Cycle filter from this article. First, with in-sample optimization for replicating the author’s MT4 results:
void run()
{
   BarPeriod = 60;
   StartDate = 2010;
   EndDate = 2020;
   LookBack = 2500;
   set(PARAMETERS);
   asset("EUR/USD");

   while(algo(loop("None","TPR","CCY")))
   {
     vars Smas = series(SMA(seriesC(),2500));
     int Color = BLACK;
     bool Filter = 1;
     if(Algo == "TPR") {
       int Period = optimize(15,10,20,1);
       var Threshold = optimize(10,0,20,2);
       var Tpr = TPR(seriesC(),1*PIP,Period,5);
       Filter = Tpr > Threshold;
       Color = BLUE;
     } else if(Algo == "CCY") {
       int Period = optimize(15,10,30,5);
       var Threshold = optimize(10,0,40,5);
       Filter = CCYIState(seriesC(),Period,Threshold);
       Color = PURPLE;
    }

    if(Filter && crossOver(Smas,seriesC()))
      enterLong();
    else if(Filter && crossUnder(Smas,seriesC()))
      enterShort();
    plot(Algo,ProfitClosed+ProfitOpen,MAIN|LINE|AXIS2,Color);
  }
}
The profit curves are plotted to the chart below, black for no filter, blue for the TPR and purple for the CCY. The blue and red vertical bars are the total equity and underwater equity. On the chart, the TPR seemingly does indeed a good job – even better than the CCY. In accordance with the author’s MT4 result, filtering a trend following system with TPR seems to almost double the return:
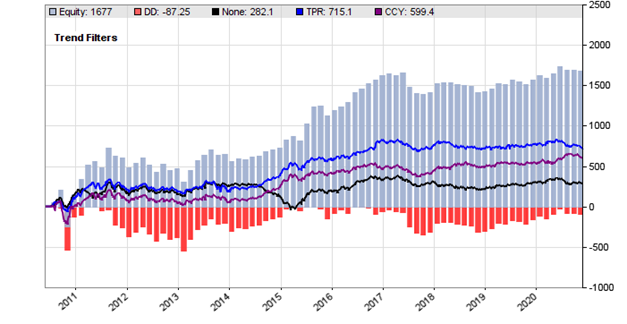
Too good to be true? The parameters were in-sample optimized, so this result is biased and would be likely different in real trading. But since the optimization was done for a 10-year period and covers many different market situations, maybe the results are not totally meaningless.
So let’s repeat the test, but this time with a serious optimization. We need these two additional commands in the script:
NumWFOCycles = 10;
DataSplit = 75;
This activates walk-forward optimization with 10 cycles split into 75% training data and 25% test data. The results of the walk-forward optimization:
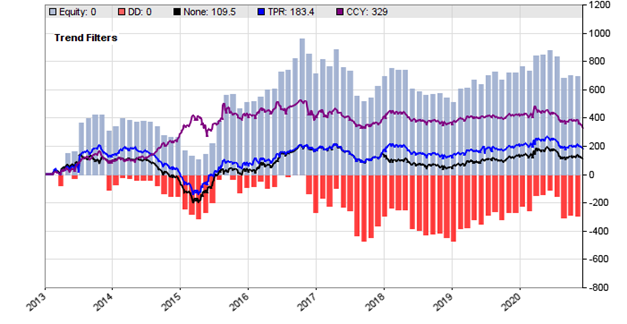
That’s what we would likely get in real trading – and unfortunately it does not quite look as good. A SMA crossover is just not a serious trading system for Forex, no matter with which filter. Still, the equity curves are somewhat positive, and the TPR still improves the return a bit, although much less so than Ehler’s Correlation Cycle.
Anyway, we now have another market regime filter in our collection, for whatever it might be good. For a comprehensive comparison of trend filters, we had to repeat this out-of-sample test with many other assets, many different time periods, and possibly better trend following methods than SMA crossings.
The TPR indicator and the trading system can be downloaded from the 2021 script repository. You’ll need Zorro 2.35 or above.
Interesting article plus programming teaching.
Thanks!
Thanks for the interesting post. What is seriesC() in your code? It doesn’t compile and I can’t find any reference in the manual.
The Close series. You need Zorro 2.35.