
The previous article dealt with indicators based on correlation with a trend line. This time we’ll look into another correlation-based indicator by John Ehlers. The new Correlation Cycle indicator (CCY) measures the price curve correlation with a sine wave. This works surprisingly well – not for generating trade signals, but for a different purpose.
Ehlers published the indicator together with TradeStation code in the recent S&C magazine. Since the C language supports function pointers, we can code it in a shorter and more elegant way:
var correlY(var Phase); // function pointer
var cosFunc(var Phase) { return cos(2*PI*Phase); }
var sinFunc(var Phase) { return -sin(2*PI*Phase); }

var correl(vars Data, int Length, function Func)
{
   correlY = Func;
   var Sx = 0, Sy = 0, Sxx = 0, Sxy = 0, Syy = 0;
   int count;
   for(count = 0; count < Length; count++) {
      var X = Data[count];
      var Y = correlY((var)count/Length);
      Sx += X; Sy += Y;
      Sxx += X*X; Sxy += X*Y; Syy += Y*Y;
   }
   if(Length*Sxx-Sx*Sx > 0 && Length*Syy-Sy*Sy > 0)
      return (Length*Sxy-Sx*Sy)/sqrt((Length*Sxx-Sx*Sx)*(Length*Syy-Sy*Sy));
   else return 0;
}

var CCY(vars Data, int Length) { return correl(Data,Length,cosFunc); }
var CCYROC(vars Data, int Length) { return correl(Data,Length,sinFunc); }
The correl function measures the correlation of the Data series with an arbitrary curve given by the Func function. This allows us to create all sorts of correlation indicators by just using a different Func. For example, it reduces Ehlers’ Correlation Trend Indicator from the previous article to 2 lines:
var trendFunc(var Phase) { return -Phase; }

var CTI(vars Data,int Length) { return correl(Data,Length,trendFunc); }
The empty correlY function pointer in the code above serves as a template for Func, and is used for calling it inside the correl function. For the CTI it’s simply a rising slope (negative because series are in reverse order), for the CCY it’s the standard cosine function.
At first let’s see how the CCY indicator behaves when applied to a sine wave. We’re using Zorro’s wave generator to produce a sine chirp with a rising cycle length from 15 up to 30 bars, which is 25% below and 50% above the used CCY period of 20 bars. The code:
function run()
{
   MaxBars = 300;
   LookBack = 40;
   asset(""); // dummy asset
   ColorUp = ColorDn = 0; // don't plot a price curve

   vars Chirp = series(genSine(15,30));
   plot("Chirp",2*Chirp[0]-1,LINE,BLUE);
   plot("CCY",CCY(Chirp,20),LINE,RED);
}
And the result:
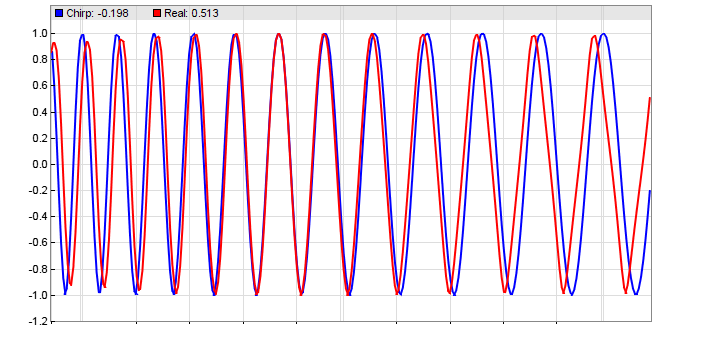 This confirms Ehlers’ stress test. A shorter period results in a phase lag, a longer period in a phase lead. We’re now going to apply the indicator to real-world price curves. This code displays the CCY and its rate of change (CCYROC) in a SPY chart:
function run()
{
   BarPeriod = 1440;
   LookBack = 40;
   StartDate = 20190101;

   assetAdd("SPY","STOOQ:SPY.US"); // load price history from Stooq
   asset("SPY");

   vars Prices = series(priceClose());
   plot("CCY(14)",CCY(Prices,14),NEW|LINE,RED);
   plot("ROC(14)",CCYROC(Prices,14),LINE,GREEN);
 }
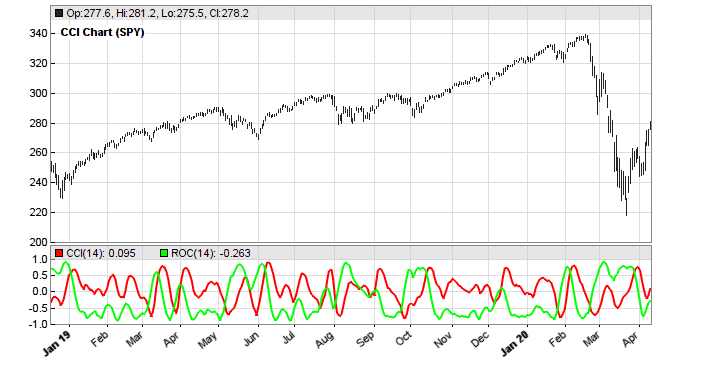
What’s the use of the Correlation Cycle indicator in a trading system? The chart might hint that its peaks or valleys could be used for trade signals, but you can save the time of testing it: I did already. The CCY is no good for trade signals. But Ehlers had another idea. The phase angle of the CCY and CCYROC reflects the market state. It returns 1 for a rising trend, -1 for a falling trend, and 0 for cycle regime. Here’s the code of Ehlers CCY market state indicator:
var CCYState(vars Data,int Length,var Threshold)
{
   vars Angles = series(0,2);
   var Real = correl(Data,Length,cosFunc);
   var Imag = correl(Data,Length,sinFunc);
// compute the angle as an arctangent function and resolve ambiguity
   if(Imag != 0) Angles[0] = 90 + 180/PI*atan(Real/Imag);
   if(Imag > 0) Angles[0] -= 180;
// do not allow the rate change of angle to go negative
   if(Angles[1]-Angles[0] < 270 && Angles[0] < Angles[1])
      Angles[0] = Angles[1];
   //return Angles[0];
// compute market state
   if(abs(Angles[0]-Angles[1]) < Threshold)
      return ifelse(Angles[0] < 0,-1,1);
   else return 0;
}
Applied to SPY:
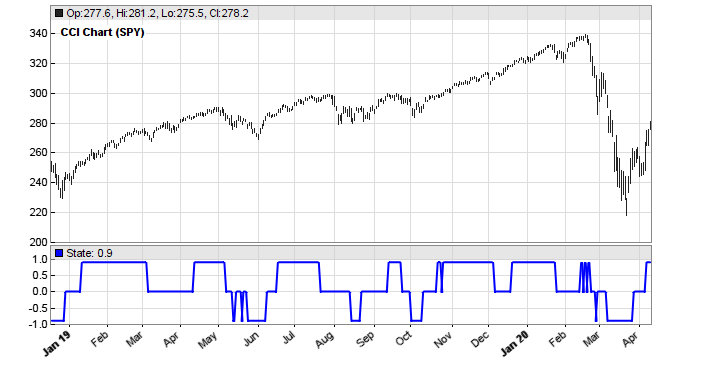
At first glance, trends and cycles seem to be rather well and timely detected. But how useful is the indicator in a real trading system?
For finding out, we’ll compare the performance with and without market state detection of a simple trend follower, as in the first Zorro workshop. It uses a lowpass filter for detecting trend reversals. The only parameter is the cutoff period of the low pass filter. This parameter is walk forward optimized, so the system does depend on any choosen parameter value. The trend follower without market state detection:
function run()
{
   set(PARAMETERS);
   BarPeriod = 1440;
   LookBack = 40;
   NumYears = 8;

   assetAdd("SPY","STOOQ:SPY.US"); // load price history from Stooq
   asset("SPY");

   NumWFOCycles = 4;
   int Cutoff = optimize(10,5,30,5);

   vars Prices = series(priceClose());
   vars Signals = series(LowPass(Prices,Cutoff));
   if(valley(Signals))
      enterLong();
   else if(peak(Signals))
      enterShort();
}
The system enters a long position on any valley of the lowpass filtered price curve, and a short position on any peak. The resulting equity curve:
We can see that the simple SPY trend follower is not very good. Yes, it’s profitable, but the main profit came from some lucky trades at the corona drop. In the years before the system had long flat periods. Let’s see if the CCYState indicator can help. Its two parameters, period and threshold, are also walk forward optimized. The new script:
function run()
{
   set(PARAMETERS);
   BarPeriod = 1440;
   LookBack = 40;
   NumYears = 8;

   assetAdd("SPY","STOOQ:SPY.US"); // load price history from Stooq
   asset("SPY");

   NumWFOCycles = 4;
   int Cutoff = optimize(10,5,30,5);
   int Period = optimize(14,10,25,1);
   var Threshold = optimize(9,5,15,1);

   vars Prices = series(priceClose());
   var State = CCYState(Prices,Period,Threshold);
   plot("State",State*0.9,NEW|LINE,BLUE);
   vars Signals = series(LowPass(Prices,Cutoff));

   if(State != 0) {
      if(valley(Signals))
         enterLong();
      else if(peak(Signals))
         enterShort();
   }
   else {
      exitLong();
      exitShort();
   }
}
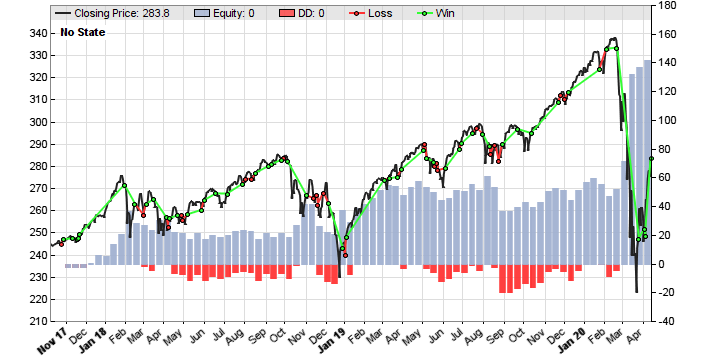
The new system trades only when the market state is 1 or -1, indicating trend regime. It goes out of the market when the market state is 0. We can see that this improves the equity curve remarkably:
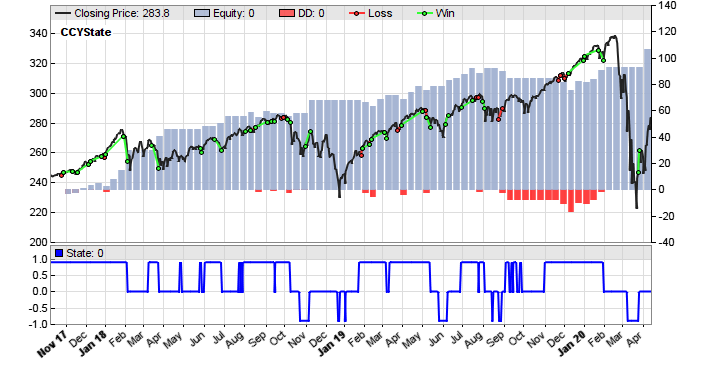
I think most people would prefer this system to the previous one, even though it stayed out of the market at the corona drop. Ehlers’ market state indicator did a good job.
Reference
John Ehlers, Correlation Cycle Indicator, Stocks&Commodities 6/2020
The indicators and trade systems are available in the Scripts 2020 repository.
it fits well into certain market conditions in sinusoidal phase.But other times it fells apart.
Thats why you better not use it for trade signals, but for market state detection.
Hey Petra,
What is the ROC function used? It looks bounded vs the formula Tradingview uses:
ROC = [(CurrentClose – Close n periods ago) / (Close n periods ago)] X 100
thanks
The ROC of something is its first derivative. d/dx cos(x) = -sin(x).
Hi Petra,
I wonder how stable a system based on this could be when adding an additional signal-/entry- and position management system for the cyclic phases as well….
cheers
Any chance we could see the full code in one entry? Zorro does not have this CCYState indicator. many thanks.
The full code should be in the Scripts 2020 archive – Petra adds all new code in there.
Hi Petra, I have reproduced your experiment and there is one strange thing in the code. The script with the State filter actually does not care, in which direction the trade is beeing opened. I mean there are short trades for State >0 and long trades for State <0. Does not this contradict the Ehlers paper ? Many thanks …
Right, it only filters by market state. The direction is by signal peaks and valleys. I remember that I tried additional filtering by market direction, but it did not improve the system further. Anyway you’re free to test it.
Yes, I changed the State detector to the „directional“ version and indeed, no positive effect. Which is bothering me a bit, because the explanation of Ehlers was strictly „directional“.
I will certainly make more tests based on your valuable work and the new indicator code. For example there is a possibility to use the Correlation Trend Indicator from your last blog also as the State detector …
Many thank for the code and your work !!
Just a few thoughts from a newbie:
You can improve the system profitability by excluding exitLong/Short when State goes back to zero and by adding the condition to Buy/Sell only when the price is over/under an optimized SMA. You also have to optimize a TakeProfit target. I just tried it to GBP/USD and it is a beauty!
EHLERS compiling…………
Read EHLERS_1.par
WFA Test: EHLERS GBP/USD 2011..2020
Read EHLERS_2.par EHLERS_3.par
Monte Carlo Analysis… Median AR 51%
Win 124$ MI 3.22$ DD 28.55$ Capital 75.59$
Trades 14 Win 85.7% Avg +97.2p Bars 6
AR 51% PF 9.23 SR 1.30 UI 7% R2 0.00
HI! Thanks for the work, I am enjoying and learning a lot.
I’ve created my rudimentary 3-indicator system (trend following + mean reversion signals under certain circumstances) , and adding this CCI as a signal filter i’ve managed to get positive results for my very first time. I would suggest an interpretation: It keeps signaling “trend mode” when a trend reversal happens. That allows the system to enter early on the beginning trend making it profitable if another indicator creates a good entry signal. If we use directionally we lose this possibility.
Interestingly, testing it from 2007 to 2020, with SPY, EURUSD and BTC, keeps positive (not amazing, but positive), just with the default.
I would say is an easy improvement for poor skilled newbies like me!
Hi Petra,
thank you for your articles.
I Have downloaded your CCY.c script willing to learn some new stuff.
#define DO_SINE , works as expected
#define DO_PLOT, gives an error while compiling
#define DO_NOSTATE, works as expected
#define DO_STATE, works, but with totally different behavior compared to the equity line and statistics you mentioned in the articles.
Am I missing something?
Thank you in advance
mp
I use #defines for activating different code parts in the same script. You can NOT arbitrarily combine them. Look in the code to check which #defines are used for which purpose.
Hi
In both your code above and the Ehlers paper the arctangent is described in terms of a the ratio of real to imaginary. Isn’t this, in fact, the reciprocal of the arctangent? If we think of the phasor diagram with the Imaginary axis being the ‘y-axis’ and the real axis being the ‘x-axis’, then tan of the phase angle would be y/x.
In addition, this definition is at odds with Ehler’s own ‘rocket science of traders’ book where he uses the same process to derive the phase angle via the Hilbert Transform.
I have just converted his code without giving it much consideration. But you are right, from math in school I remember that a phase angle is atan(sin/cos), not atan(cos/sin) as in the code. But swapping sin and cos is a 90 degrees rotation and I think that’s why Ehlers adds 90 to the result. The end result is anyway based on angle difference, not on absolute angle. Maybe Ehlers can explain why he has calculated it in this way.
Why did I found this blog?!! Can’t stop reading… I should be sleeping… argh…
Hi, Can I have the definitive Period and Threshold/Length Optimized In your test? Thank you
No, because it’s a walk forward optimization. Lengths and periods change all the time.
What programming language is for your code above. Is it in Pine Script? Thanks.
C.
Thanks. I used ChatGPT to do the conversion of your code to Python but somehow the correlation angles and market states results do not come out right. In case if you are familiar with Python, below is the Python’s version of your CCYState(). The variable ‘previous_angle’ is initialized to 0 on the outer loop where each bar is step through. At the end of each bar cycle, ‘previous_angle’ is updated to have the ‘current_angle’ value. Do you see anything in the code that might not be correct or have a suggestion on how to convert your code to Python? Thank you.
def CCYState(Data, Length, Threshold, previous_angle):
Real = correl(Data, Length, cosFunc)
Imag = correl(Data, Length, sinFunc)
# Compute the angle as an arctangent function and resolve
ambiguity
if Imag == 0:
current_angle = 0
else:
current_angle = 90 + math.degrees(np.arctan(Real/Imag))
if Imag > 0:
current_angle -= 180
# Do not allow the rate change of angle to go negative
if previous_angle – current_angle < 270 and current_angle <
previous_angle:
current_angle = previous_angle
# Compute market state
if abs(current_angle – previous_angle) < Threshold:
if current_angle = 0:
state = 1
else:
state = 0
return state, current_angle
I am no Python expert, but the begin – the Real and Imag calculation – does not look right to me. Also Python might have some subtle differences that affect the result.
Thank you. I will look into that.