
The Fisher Transform converts data to or from a Gaussian distribution. It was first used in algorithmic trading by John Ehlers (1) , and became a common part of indicators since then. In a TASC February 2022 article, Ehlers described a new indicator, the Elegant Oscillator, based on the Inverse Fisher Transform. Let’s have a look at this indicator and how it’s used in a trading system.
First, the Fisher Transform and its inverse in code:
var Fisher(vars Data)
{
  var V = clamp(Data[0],-0.999,0.999);
  return 0.5*log((1.+V)/(1.-V));
}

var FisherInv(vars Data)
{
  var V = exp(2.*Data[0]);
  return (V-1.)/(V+1.);
}
The Inverse Fisher Transform (IFT) is used in the Elegant Oscillator to convert a normalized derivative of a price series to the +/-1 range. The normalization is done by dividing by the square root of the sum of squares, a sort of N-dimensional distance. Using the IFT is supposedly a better method than simply clipping the data. The result is smoothed by Ehlers’ ‘SuperSmoother’, a low-lag lowpass filter. The Elegant Oscillator code in C for Zorro:
var EO(vars Data,int Length)
{
  vars Derivs = series(Data[0]-Data[2]);
  var RMS = sqrt(SumSq(Derivs,Length)/Length);
  var NDeriv = Derivs[0]/RMS;
  vars IFishs = series(FisherInv(&NDeriv));
  return Smooth(IFishs,20);
}
SumSq() is a helper function for summing up the squares of a data series, and Smooth() is Ehlers’ ‘SuperSmoother’ that’s already in the Zorro library. Since the FisherInv function needs only a data series of length 1, I could simply pass a pointer to the NDeriv variable instead of a series of it. For comparison, here’s the simple code for hard clipping the data:
var HardClip(vars Data)
{
  var Deriv = Data[0]-Data[2];
  vars Clips = series(clamp(Deriv,-1,1));
  return FIR6(Clips);
}
The clipped data is this time smoothed with a finite response filter (FIR6). Here’s a SPY chart with the Elegant Oscillator (upper red line), the Inverse Fisher Transform smoothed with a finite response filter (lower red line), and the hard clipped variant (blue line).
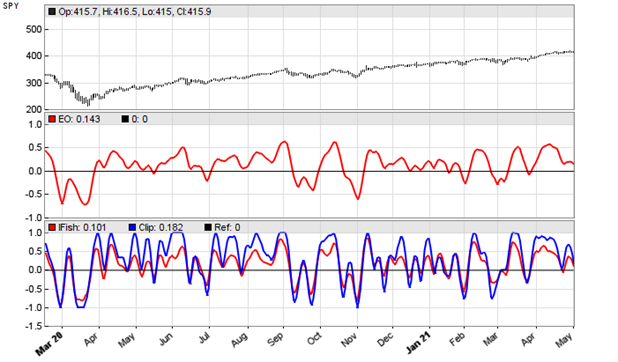
Of the 3, the super smoothed Elegant Oscillator makes the best impression and appears to generate the best signals. According to Ehlers, its peaks and valleys that exceed a threshold can be used for mean reversion trading. Let’s put that to the test. The code:
void run()
{
  StartDate = 20200301;
  EndDate = 20210501;
  BarPeriod = 1440;
  asset("SPY");
  vars Signals = series(EO(seriesC(),50));
  var Threshold = 0.5;
  if(Signals[0] > Threshold && peak(Signals))
    enterShort();
  else if(Signals[0] < -Threshold && valley(Signals))
    enterLong();
}
The resulting chart:
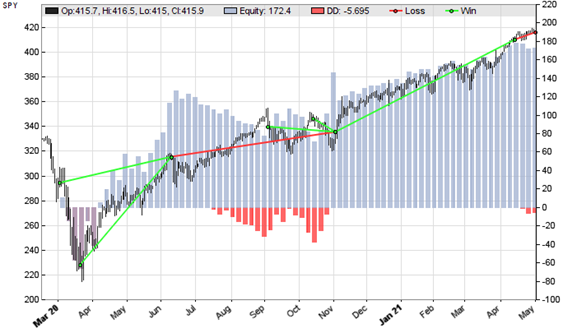
Indeed, 5 of 7 trades in that time period were winning, producing an overall positive result with a profit factor above 6. Of course, 7 trades won’t tell much, so I encorage anyone to experiment with different instruments and different time periods for determining the real value of the EO oscillator for mean reversion trading.
The oscillator and trading strategy can be downloaded from the 2021 script repository.
(1) John Ehlers, Cybernetic Analysis of Stocks and Futures, Wiley 2004
Interesting stuff!
In the function HardClip, the variable RMS is calculated but not used. Was that omitted from the calculation below it?
Could you please include this SumSq helper function?
var SumSq(vars Data,int Length)
{
var Ex = 0;
int i;
for(i=0; i<Length; i++)
Ex += Data[i]*Data[i];
return Ex;
}
And RMS was indeed a leftover, I’ll remove it.
Well… First tryouts negative. Ain’t finding a good use of it. Nevertheless – thanks for a blog post!
Have you found any of Ehler’s work actually useful in making profitable trading algos? I wasted thousands of dollars on his workshop.
I dont know about his workshops, but found his work absolutely useful, at least the algorithms from his books. It may be not so with some of his articles in TASC. But I can tell that we use his spectral filter functions all the time and with good success. You just have to know what they do and when to use them.
I’ve used his work from his last book too. I too found it hard to get positive results using his work in my discretionary trading as there were too many signals and trend changes caused his filters to give perfectly wrong timing for entries.
To try to correct this problem I instead first find phases in the market another way besides using his code to give a more orthoganal foundation to his filters. The reason this worked better I think is that, while his work is seminal, his variable lookback periods are derived from within his DSP filters and then reintroduced into other aspects of code in his Bandpass or Decycler filters, for example. Such varying phaselengths/lookback periods are great in principle but his are never free of the filters and can’t be said to be providing them with real world inputs. I think this is why they fail at trend changes.
Instead, I calculate short, mid and long term varying phaselengths from pivots. Short term phaselengths from the overall length of the time between last four consecutive simple high and low short term pivots. (e.g. my short term pivot high has a lower high immediately on either side). And so on with mid and long term pivots being derived from the short term ones where, for example a mid term pivot high is found when a short term pivot high has a short term lower pivot high immediately on either side. (Or as immediately close as they can exist in such cases.) And so on for long term phaselengths.
This took a while but the results are very encouraging and I’m keen to try automating.
I am an options trader. Personnally I often use the Ehler’s spectral filters. Not to enter into a trade (I use other methods to do so, based on option strategies) but to estimate a trend, an equilibrium. For example, I will hesitate to enter a bullish strategy if one my Ehler’s spectral filter is in the “up” zone. And it often (not always, as usual in trading) gives me a good advice. Ehler’s spectral filters are one of my “check points” on my check list.
Agree with Rob that it is hard to get positive results in real-word using Ehler’s filters or any of his defaults. They have poor predictability when used as features in ML models too
I ran the code above (downloaded from the repository) but did not got any trades. What I did wrong? Thanks
Maybe not enabling the trades?
How do you use the FIR filter like that of FIR3 to implement a high pass filter at a certain cut-off period, Tc? Thanks.
FIR is a very simple filter. For a highpass with a certain cut-off period you need a more complex filter.