The exponential moving average (EMA) and the Relative Strength Indicator (RSI) are both very popular and useful indicators for algorithmic trading. So why no glue both together to get an even better indicator? That was the basic idea of Vitali Apirine’s TASC 3/2022 article. We’re measuring the relative strength of a volatility index (VIX), and use the result as an EMA time period. Do we now have the ultimate indicator to beat them all?
The algorithm from Vitali’s article, slightly reformulated for clarity:
RSEMA[0] = Alpha * Price + (1-Alpha) * RSEMA[1]
This is a classical EMA, but with a volatility dependent alpha factor:
Alpha = 2/(TimePeriod+1) * (1 + 10*abs(EMAUp-EMADn)/(EMAUp+EMADn))
EMAUp and EMADn are the VIX EMA of days with positive returns and the VIX EMA of days with negative returns. The separation into positive and negative days resembles the RSI. And we have a double EMA in this formula, which will hopefully render the result twice as good. The factor 10 is inserted for getting an even better result.
VIX historical data is not available via API from free online sources as far as I know, but it can be downloaded from most brokers with the Zorro Download script. The resulting RSEMA code in C for Zorro:
var RSEMA(int Periods, int PdsEMA, var Mltp)
{
  asset("VIX");
  var VolatC = priceC();
  asset(AssetPrev); // re-select asset
  var VolatUp = series(ifelse(RET(1)>0,VolatC,0)),
    VolatDn = series(ifelse(RET(1)<0,VolatC,0));
  var EMAUp = EMA(VolatUp,PdsEMA), EMADn = EMA(VolatDn,PdsEMA);
  var RS = abs(EMAUp-EMADn)/(EMAUp+EMADn+0.00001)*Mltp;
  var Rate = 2./(Periods+1)*(RS+1);
  return EMA(priceC(),Rate);
}
AssetPrev is the asset that was selected when the RSEMA function is called. Adding 0.00001 to the divisor prevents a crash by division by zero. Note that the often used EMA is available in two versions, to be called with a data series or with a single variable. I’m using the variable version here.
The RSEMA(10,10,10) applied on a SPX500 chart replicates the chart in the TASC article:
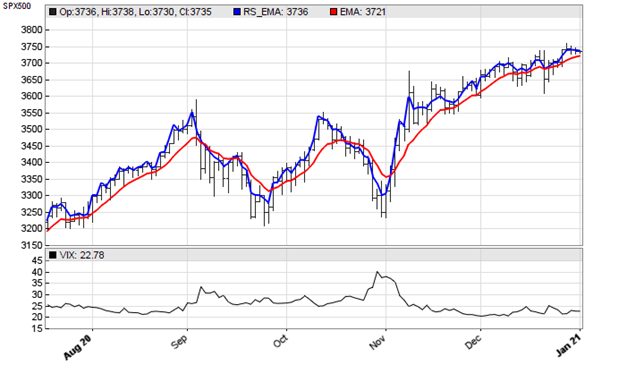
We can see that the RSEMA (blue) has noticeably less lag than the EMA (red), which is not really surprising because the higher alpha rate is equivalent to a smaller EMA time period. The author believed that EMA crossovers of this indicator can be used as entry points for long trades. But with the caveat that they “produce lots of whipsaws […] and should be used in conjunction with price analysis”.
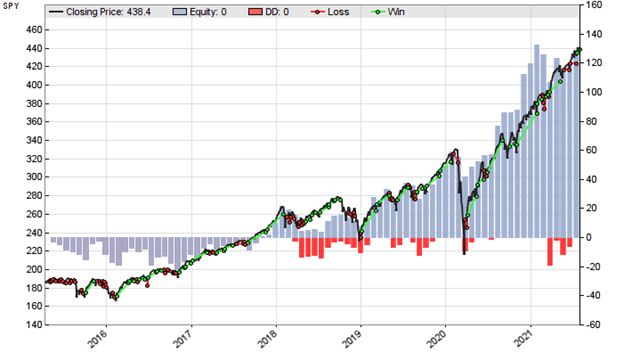
He’s certainly right. A long-only SPY trading system with RSEMA-EMA crossovers at default parameter values produced a positive end result, as seen in the chart below. But with large drawdowns and, sadly, far less profitable than buy-and-hold. So, be sure to use it only in conjunction with price analysis. Whatever that means. And better not on a real money account.
For your own experiments, the RSEMA indicator and the SPY trading system can be downloaded from the 2022 script repository.
This goes in a junk box.
Thanks for the post, though.
Thank you for keeping us informed about TASC articles. I wonder why there isnt any better, maybe they dont want to share the good ones 😀
Hello, can you provide the link for script repository?
Lol, i found answer after wrote the message, thanks for your work btw! 🙂